Introduction
Michael Bücker
Professor of Data Science at Münster School of Business

The incumbent: Score Cards
Steps for Score Card construction using Logistic Regression (Szepannek 2017)
- Automatic binning
- Manual binning
- WOE/Dummy transformation
- Variable shortlist selection
- (Linear) modelling and automatic model selection
- Manual model selection
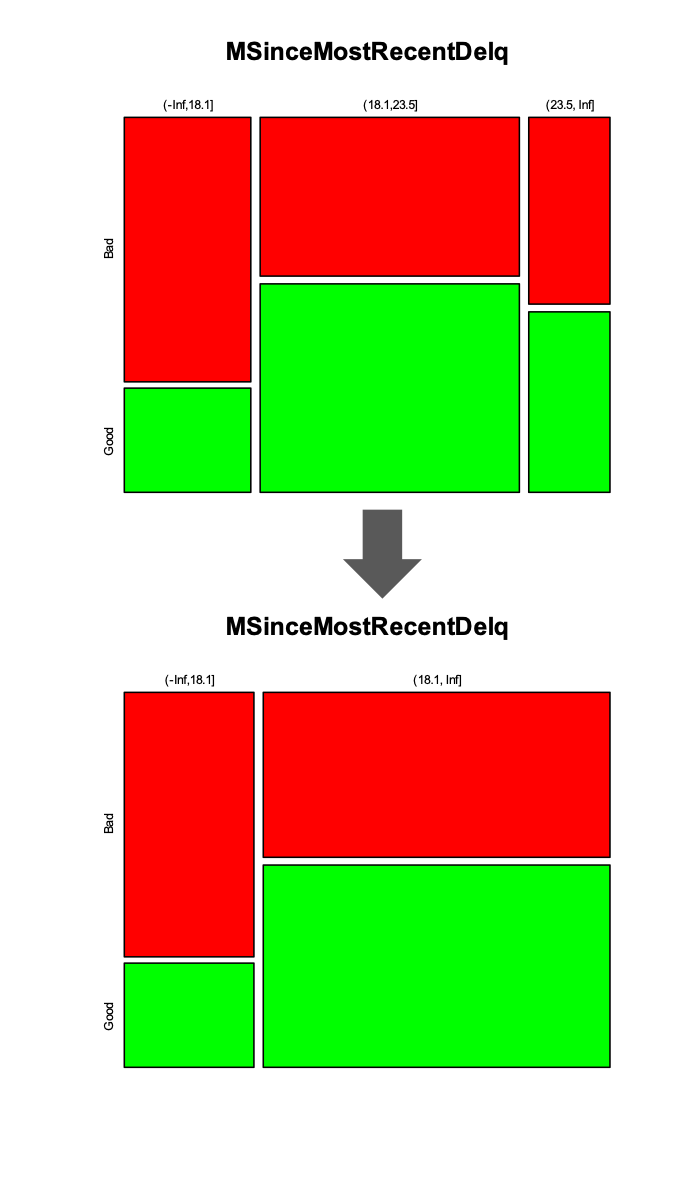
Score Cards: Manual binning
Manual binning allows for
- (univariate) non-linearity
- (univariate) plausibility checks
- integration of expert knowledge for binning of factors
... and means a lot of manual work

Data set for study: xML Challenge by FICO
- Explainable Machine Learning Challenge by FICO (2019)
- Focus: Home Equity Line of Credit (HELOC) Dataset
- Customers requested a credit line in the range of $5,000 - $150,000
- Task is to predict whether they will repay their HELOC account within 2 years
- Number of observations: 2,615
- Variables: 23 covariates (mostly numeric) and 1 target variable (risk performance "good" or "bad")


Implementation in R: DALEX
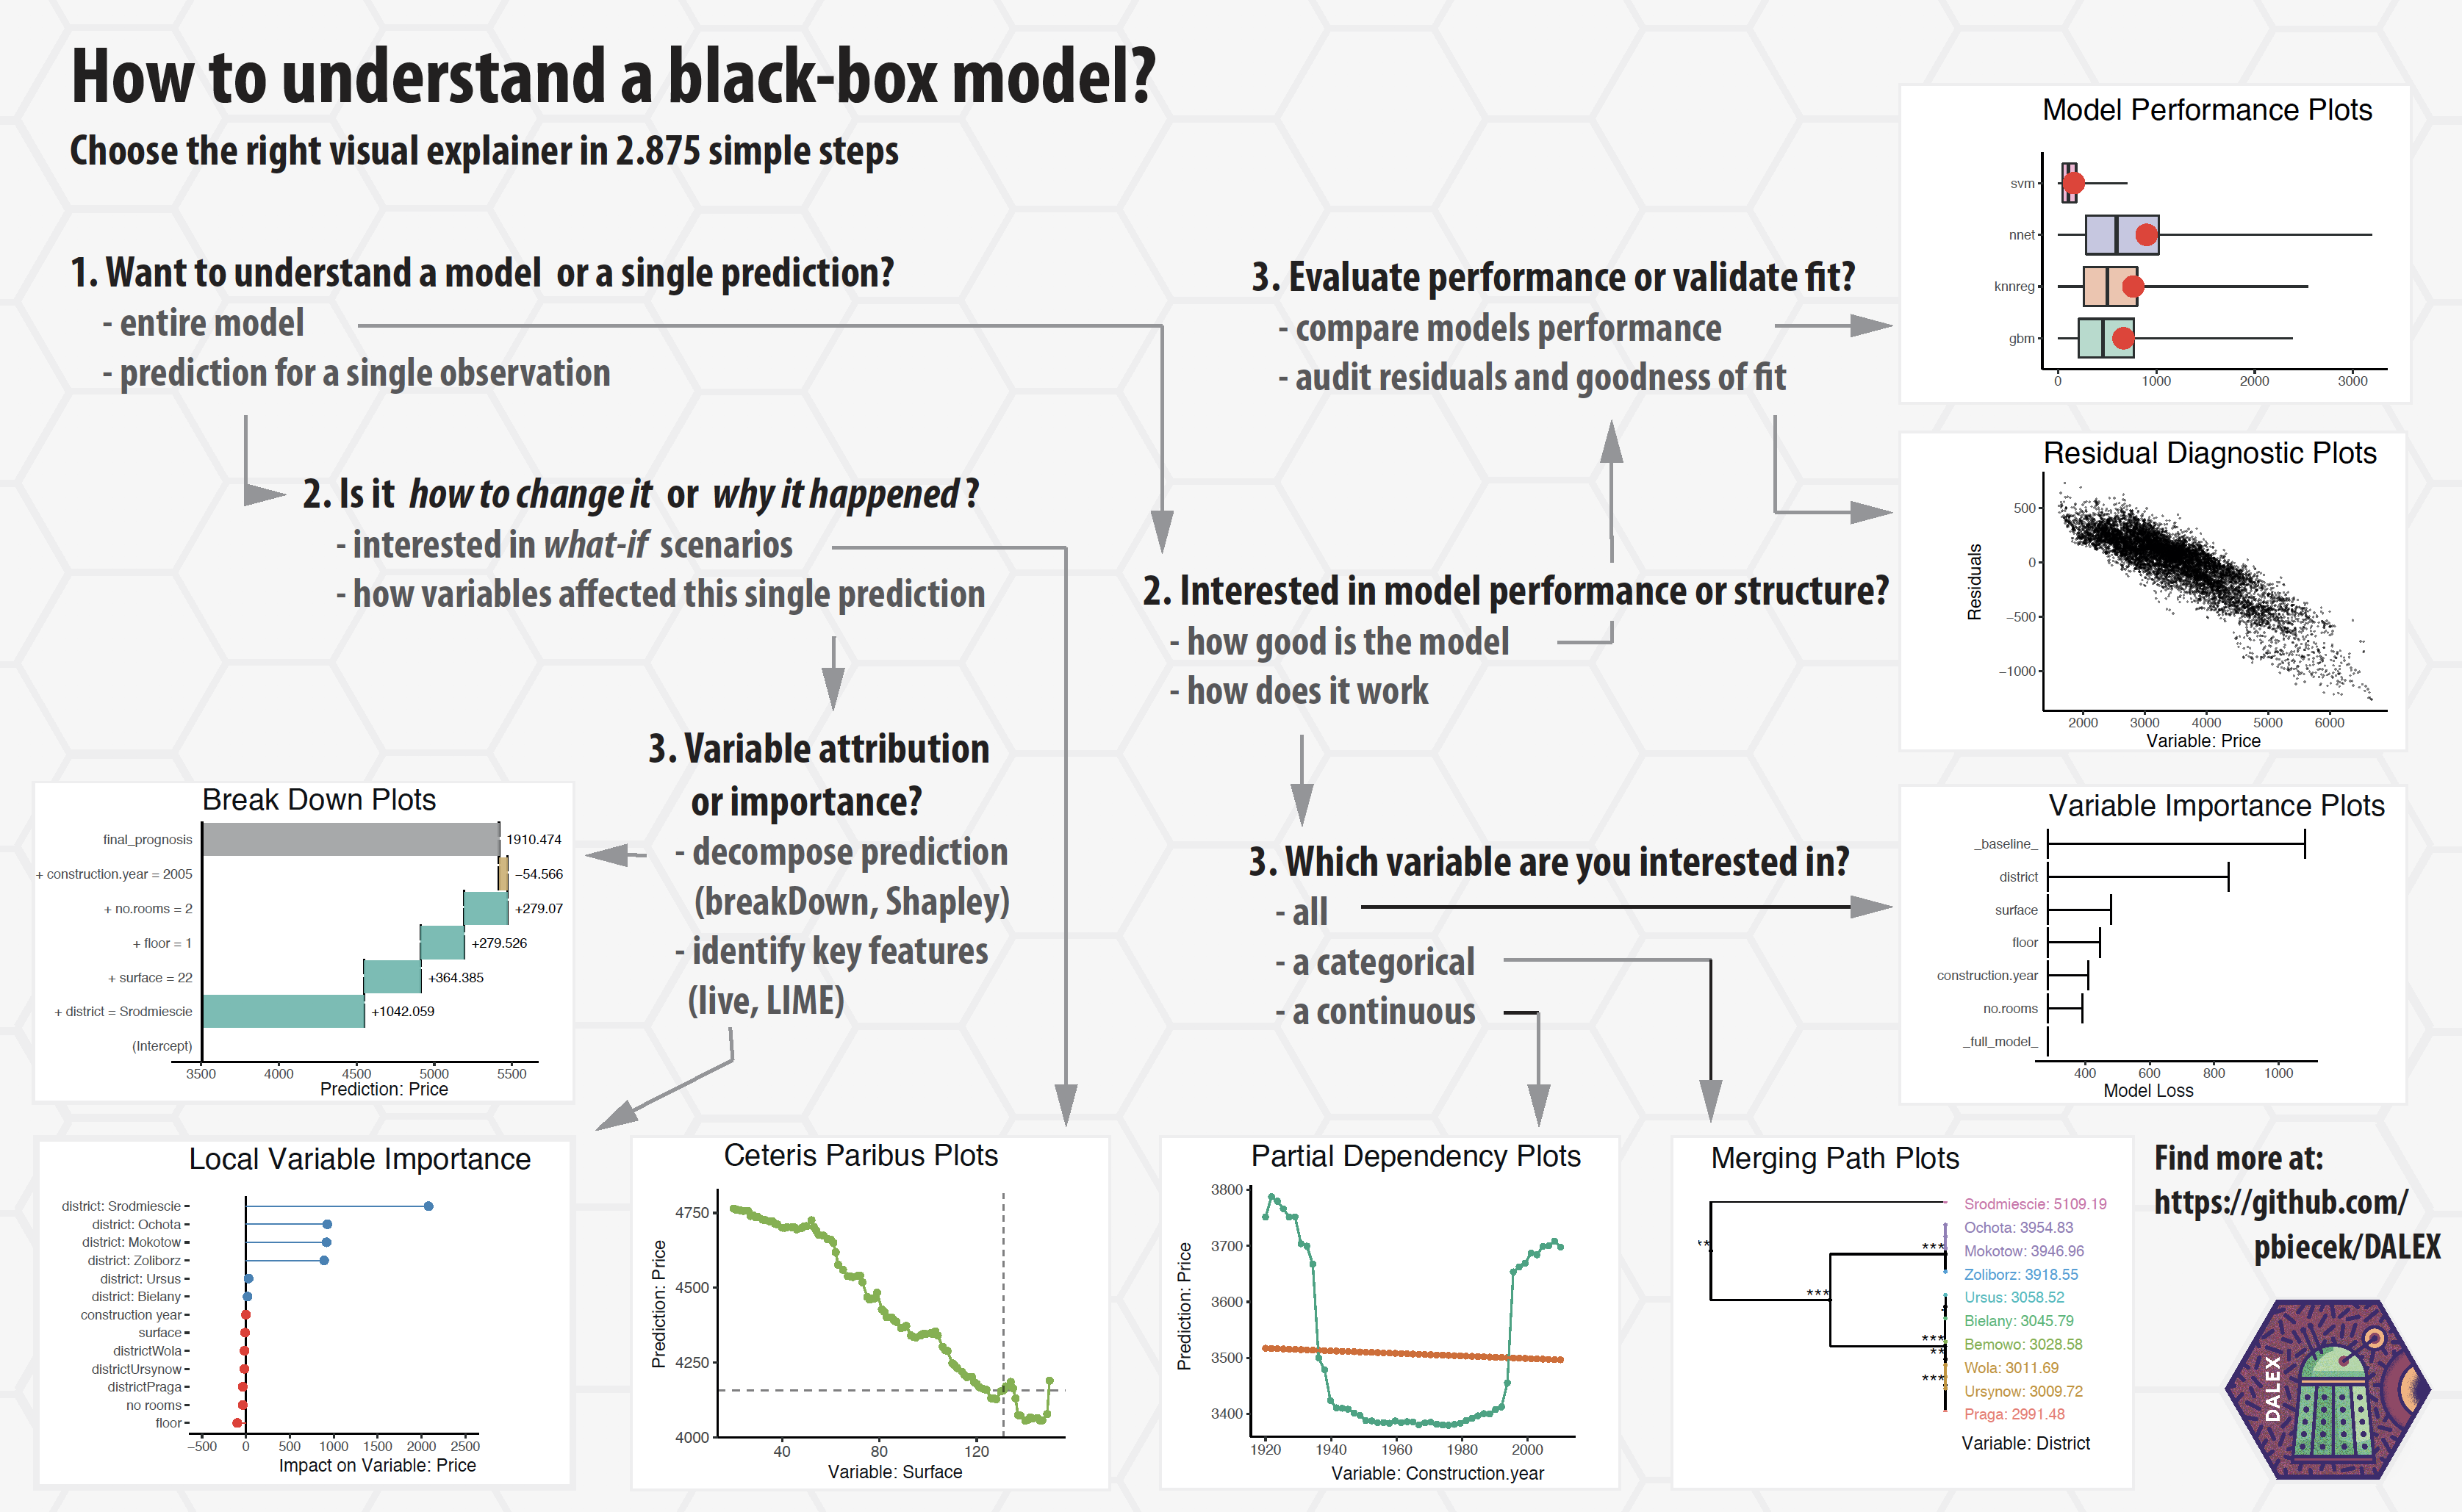
- Descriptive mAchine Learning EXplanations
- DALEX is a set of tools that help to understand how complex models are working
Results: Comparison of model performance
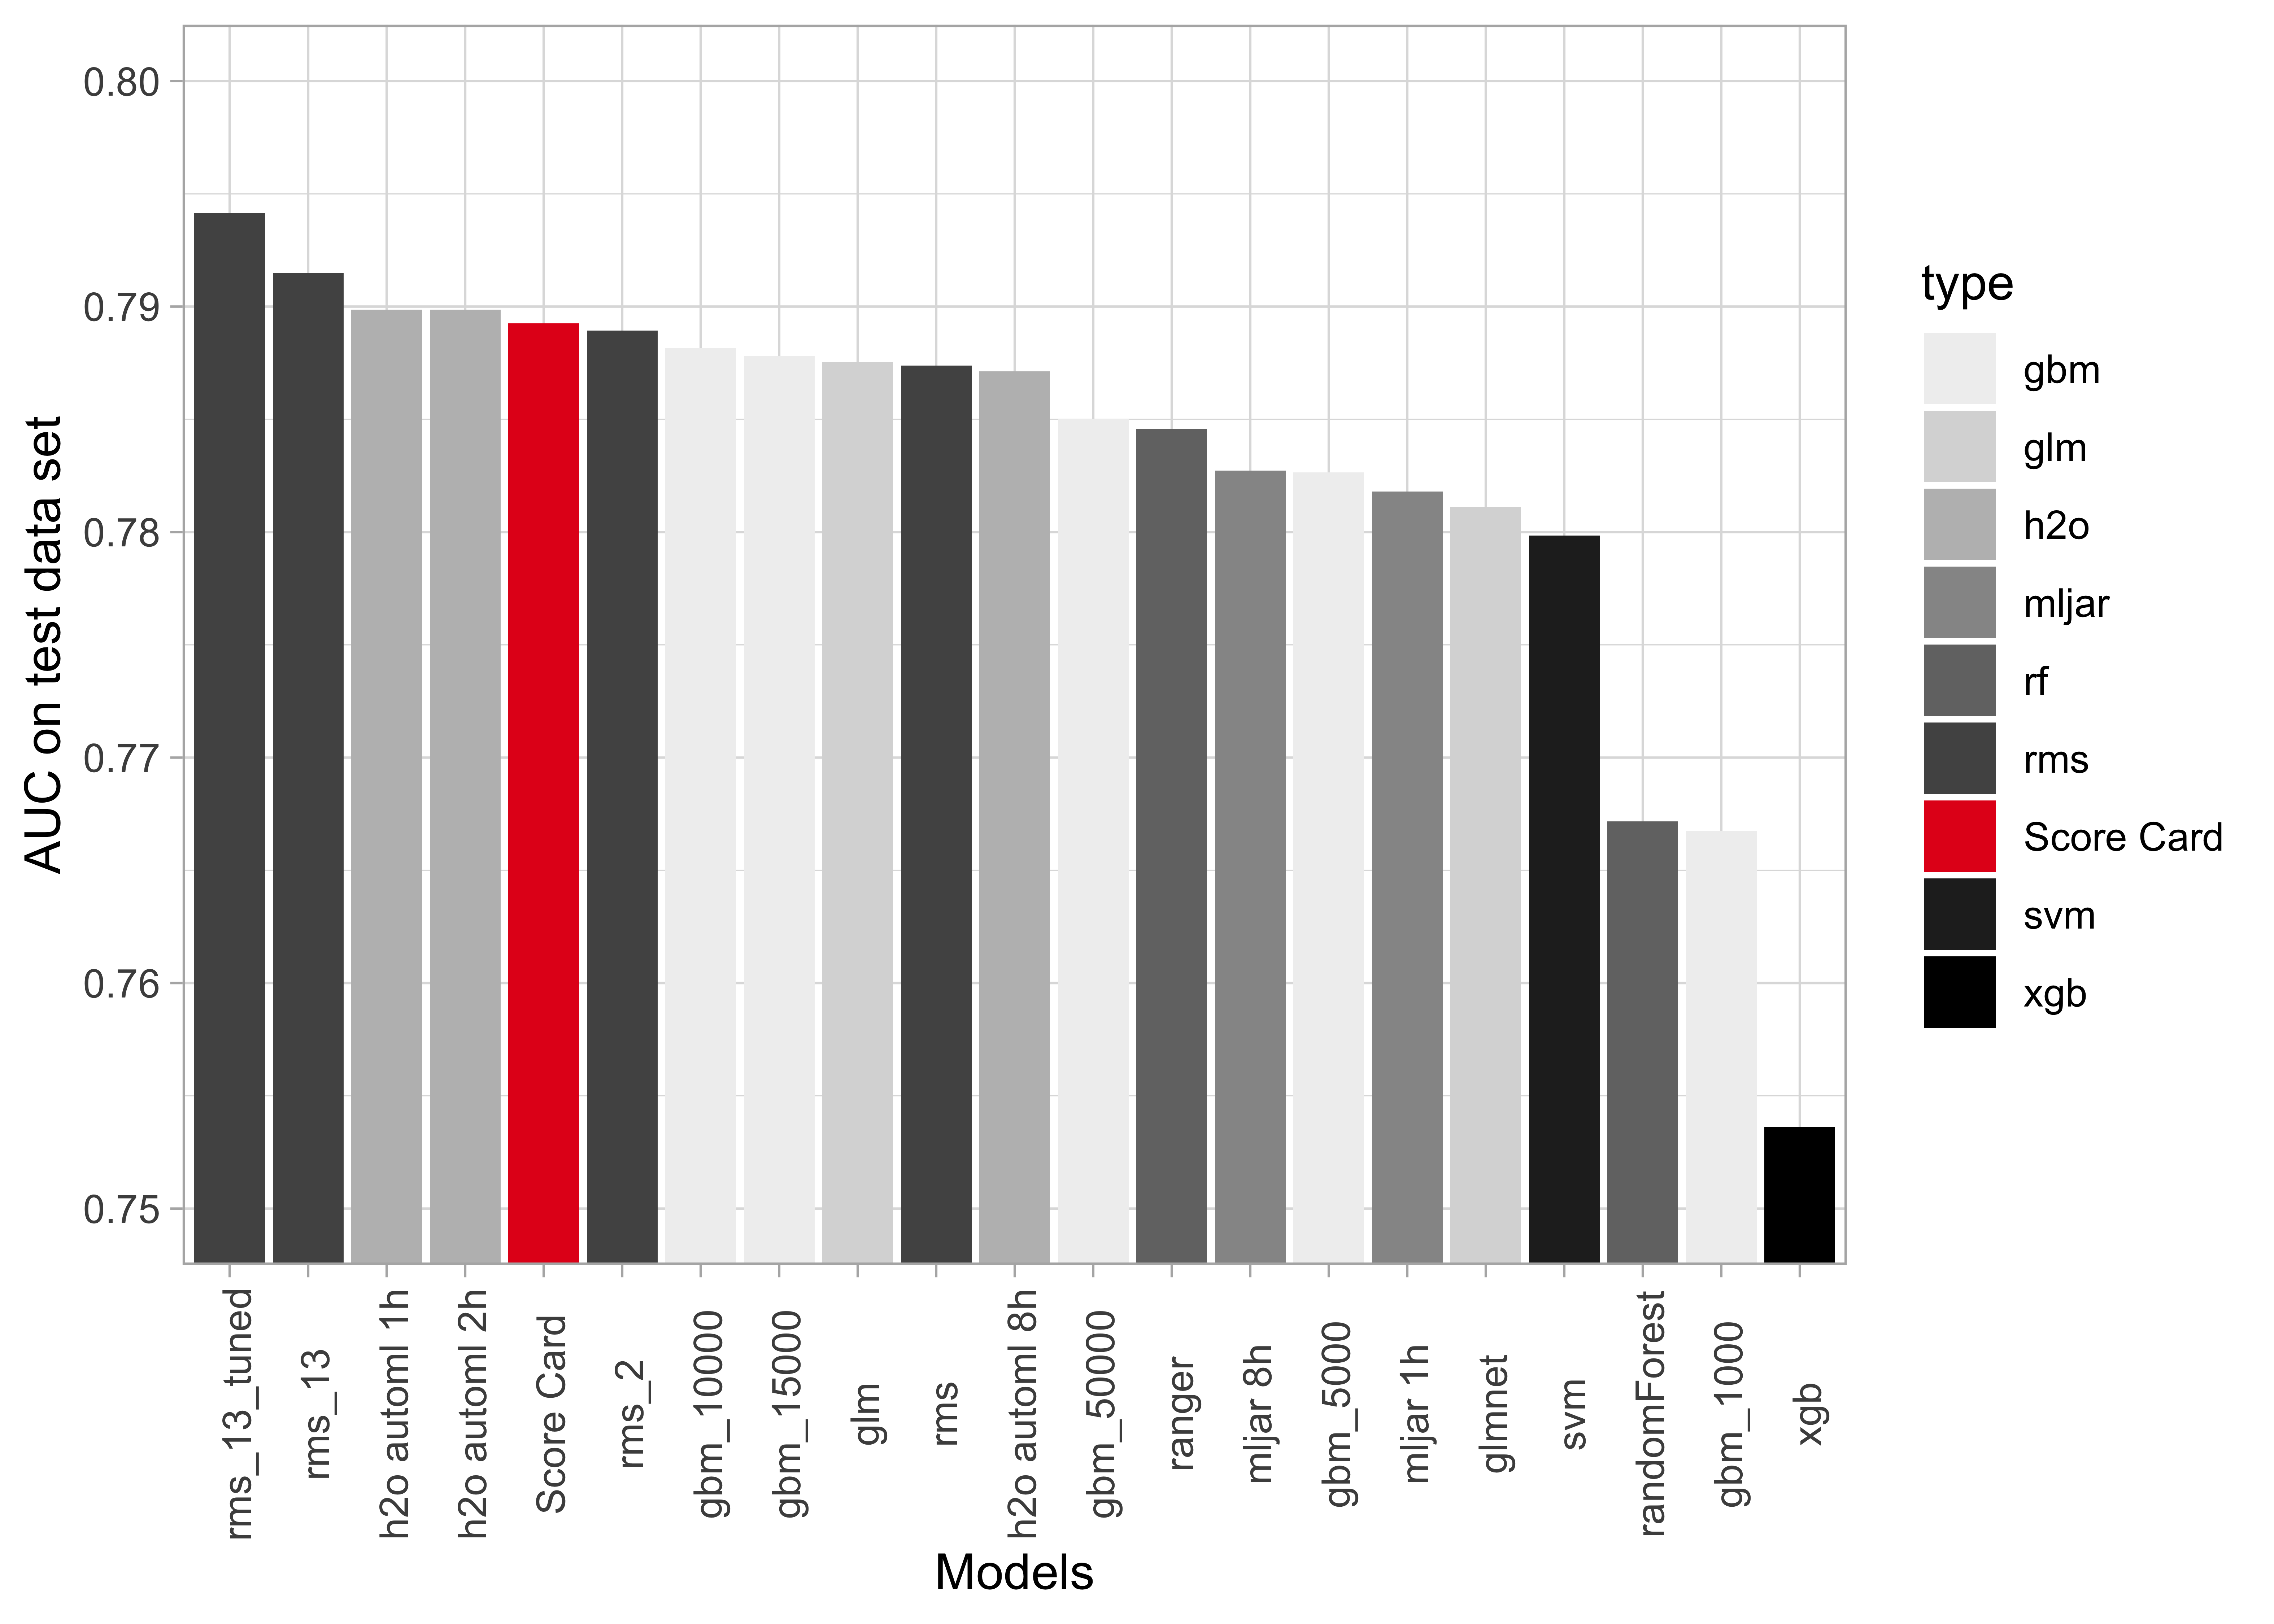
- Predictive power of the traditional Score Card model surprisingly good
- Logistic Regression with spline based transformations best, using
rmsby Harrell Jr (2019)
Results: Comparison of model performance
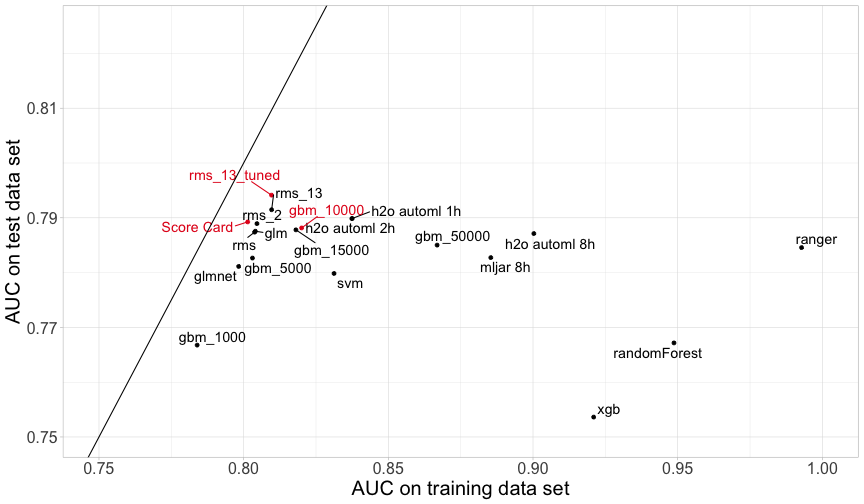
For comparison of explainability, we choose
- the Score Card,
- a Gradient Boosting model with 10,000 trees,
- a tuned Logistic Regression with splines using 13 variables
Score Card: Variable importance as range of points
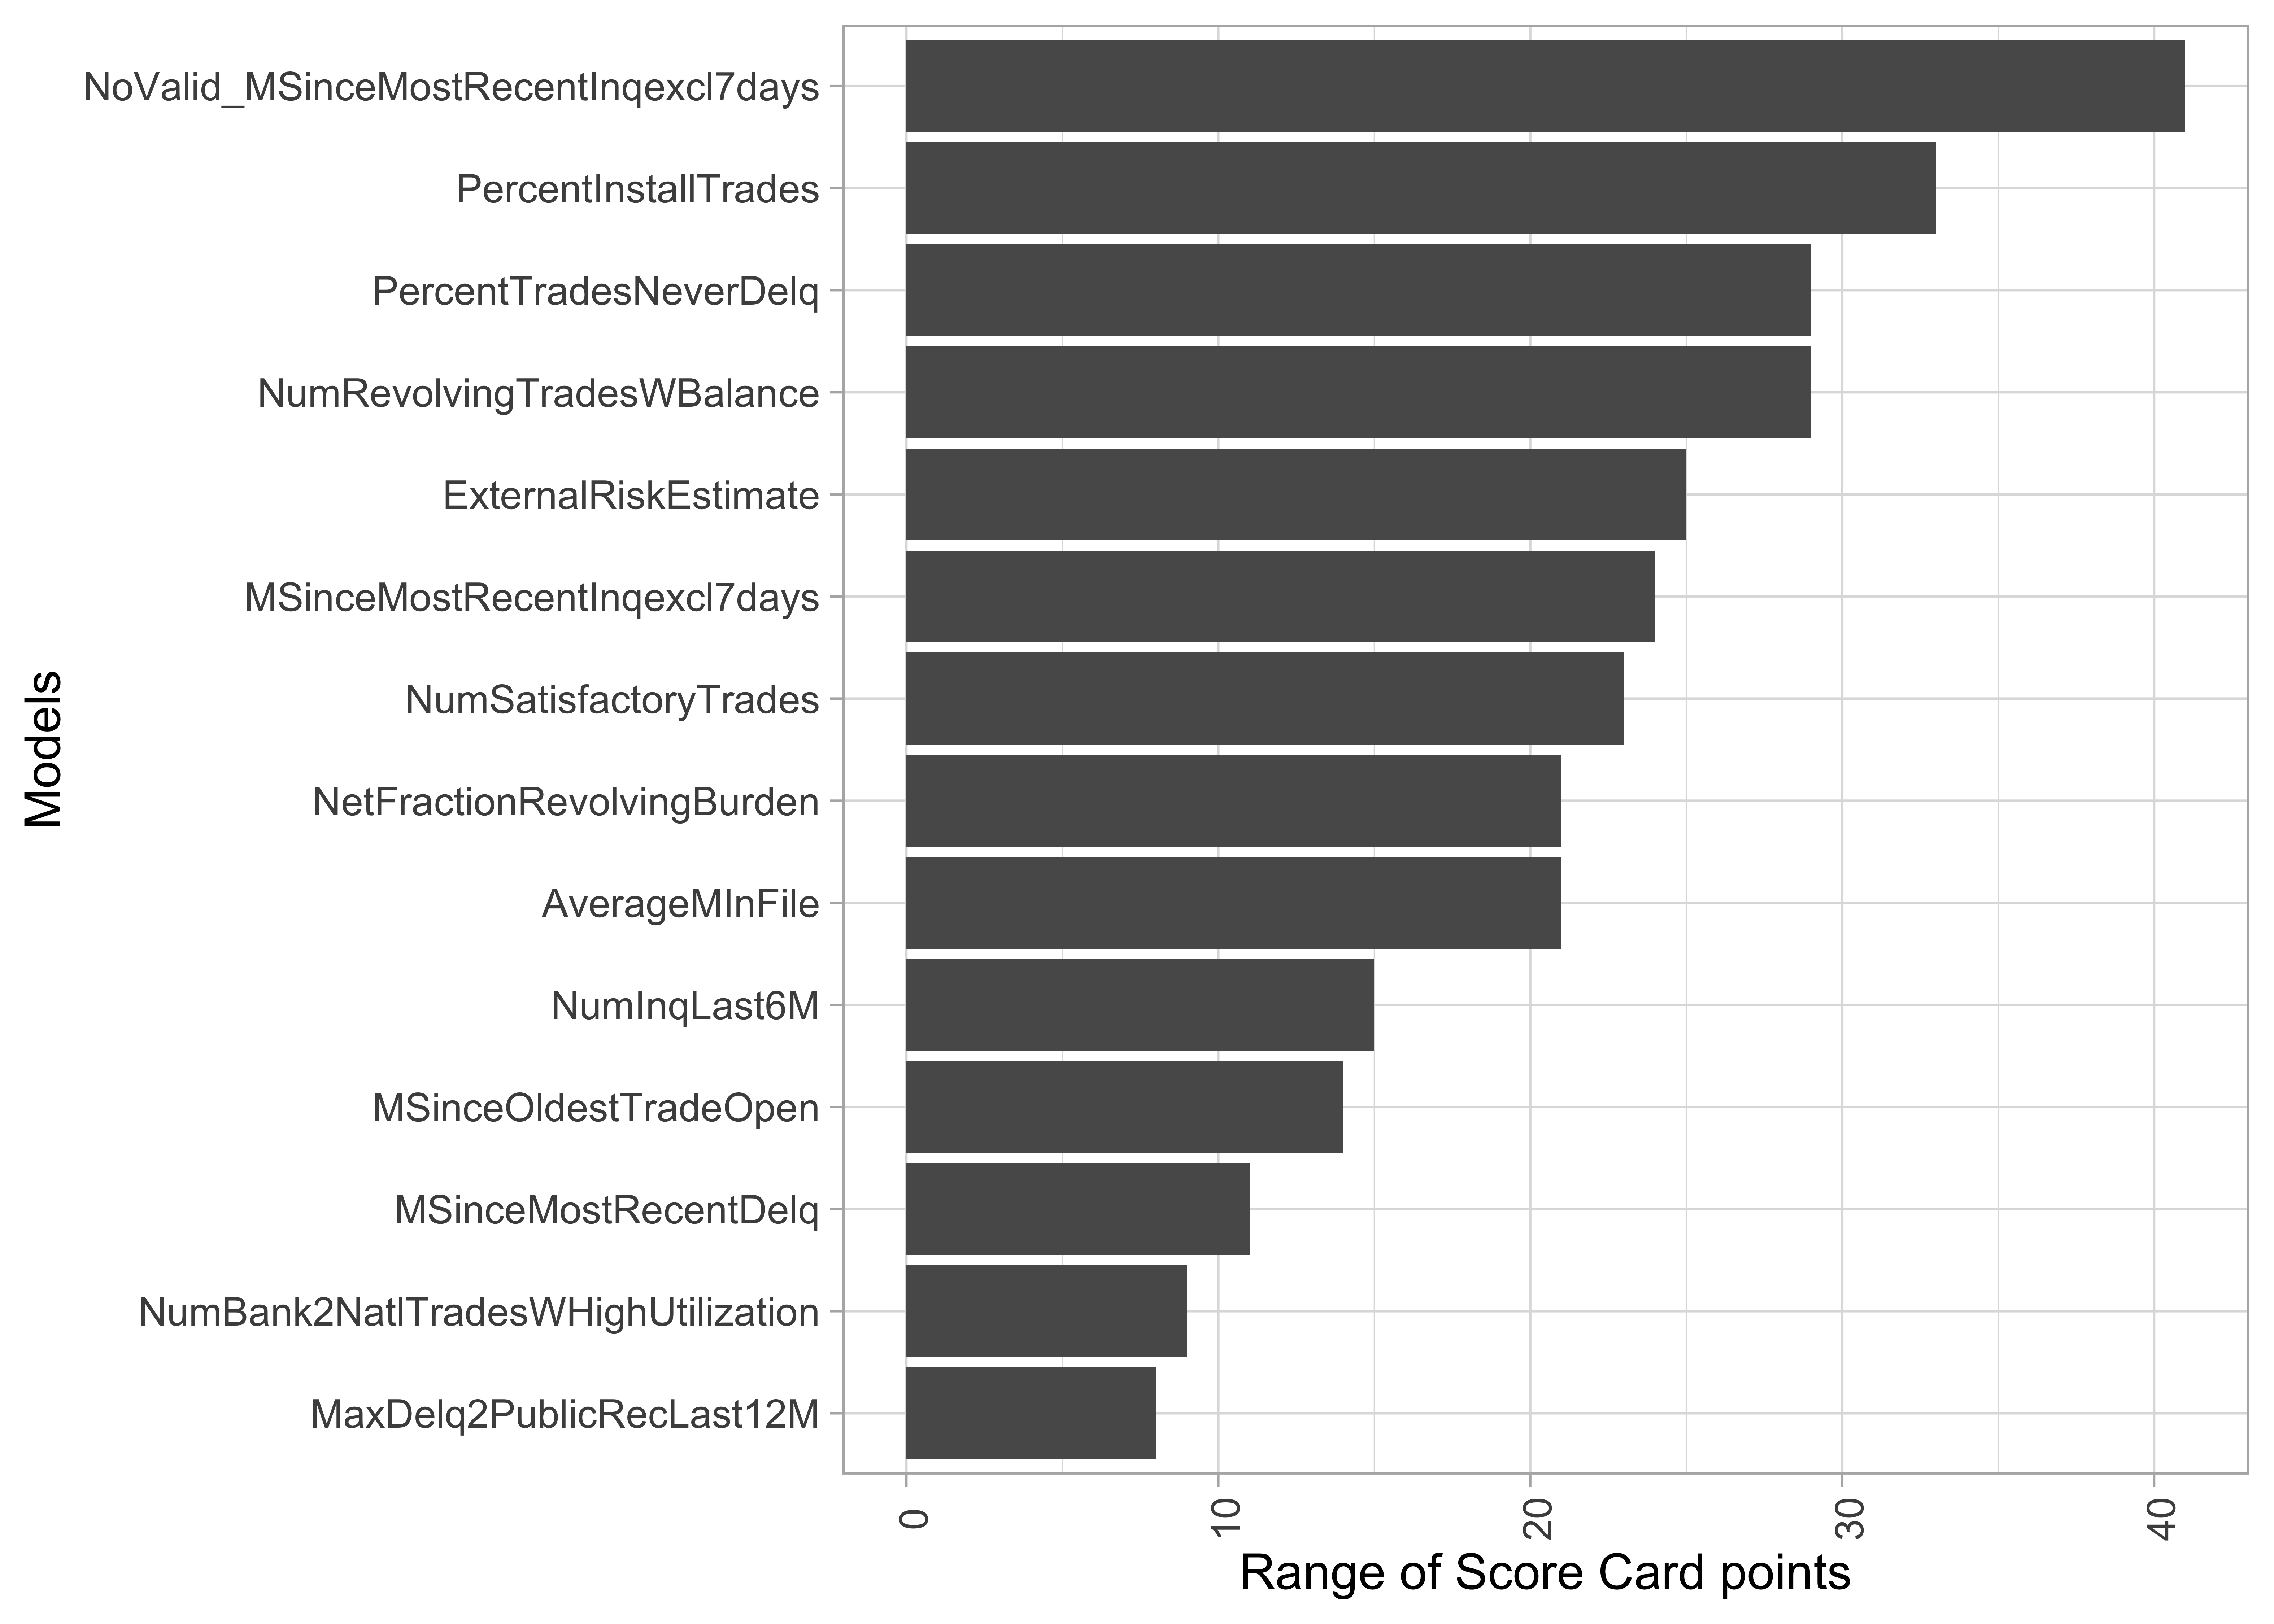
- Range of Score Card point as an indicator of relevance for predictions
- Alternative: variance of Score Card points across applications
Model agnostic: Importance through drop-out loss
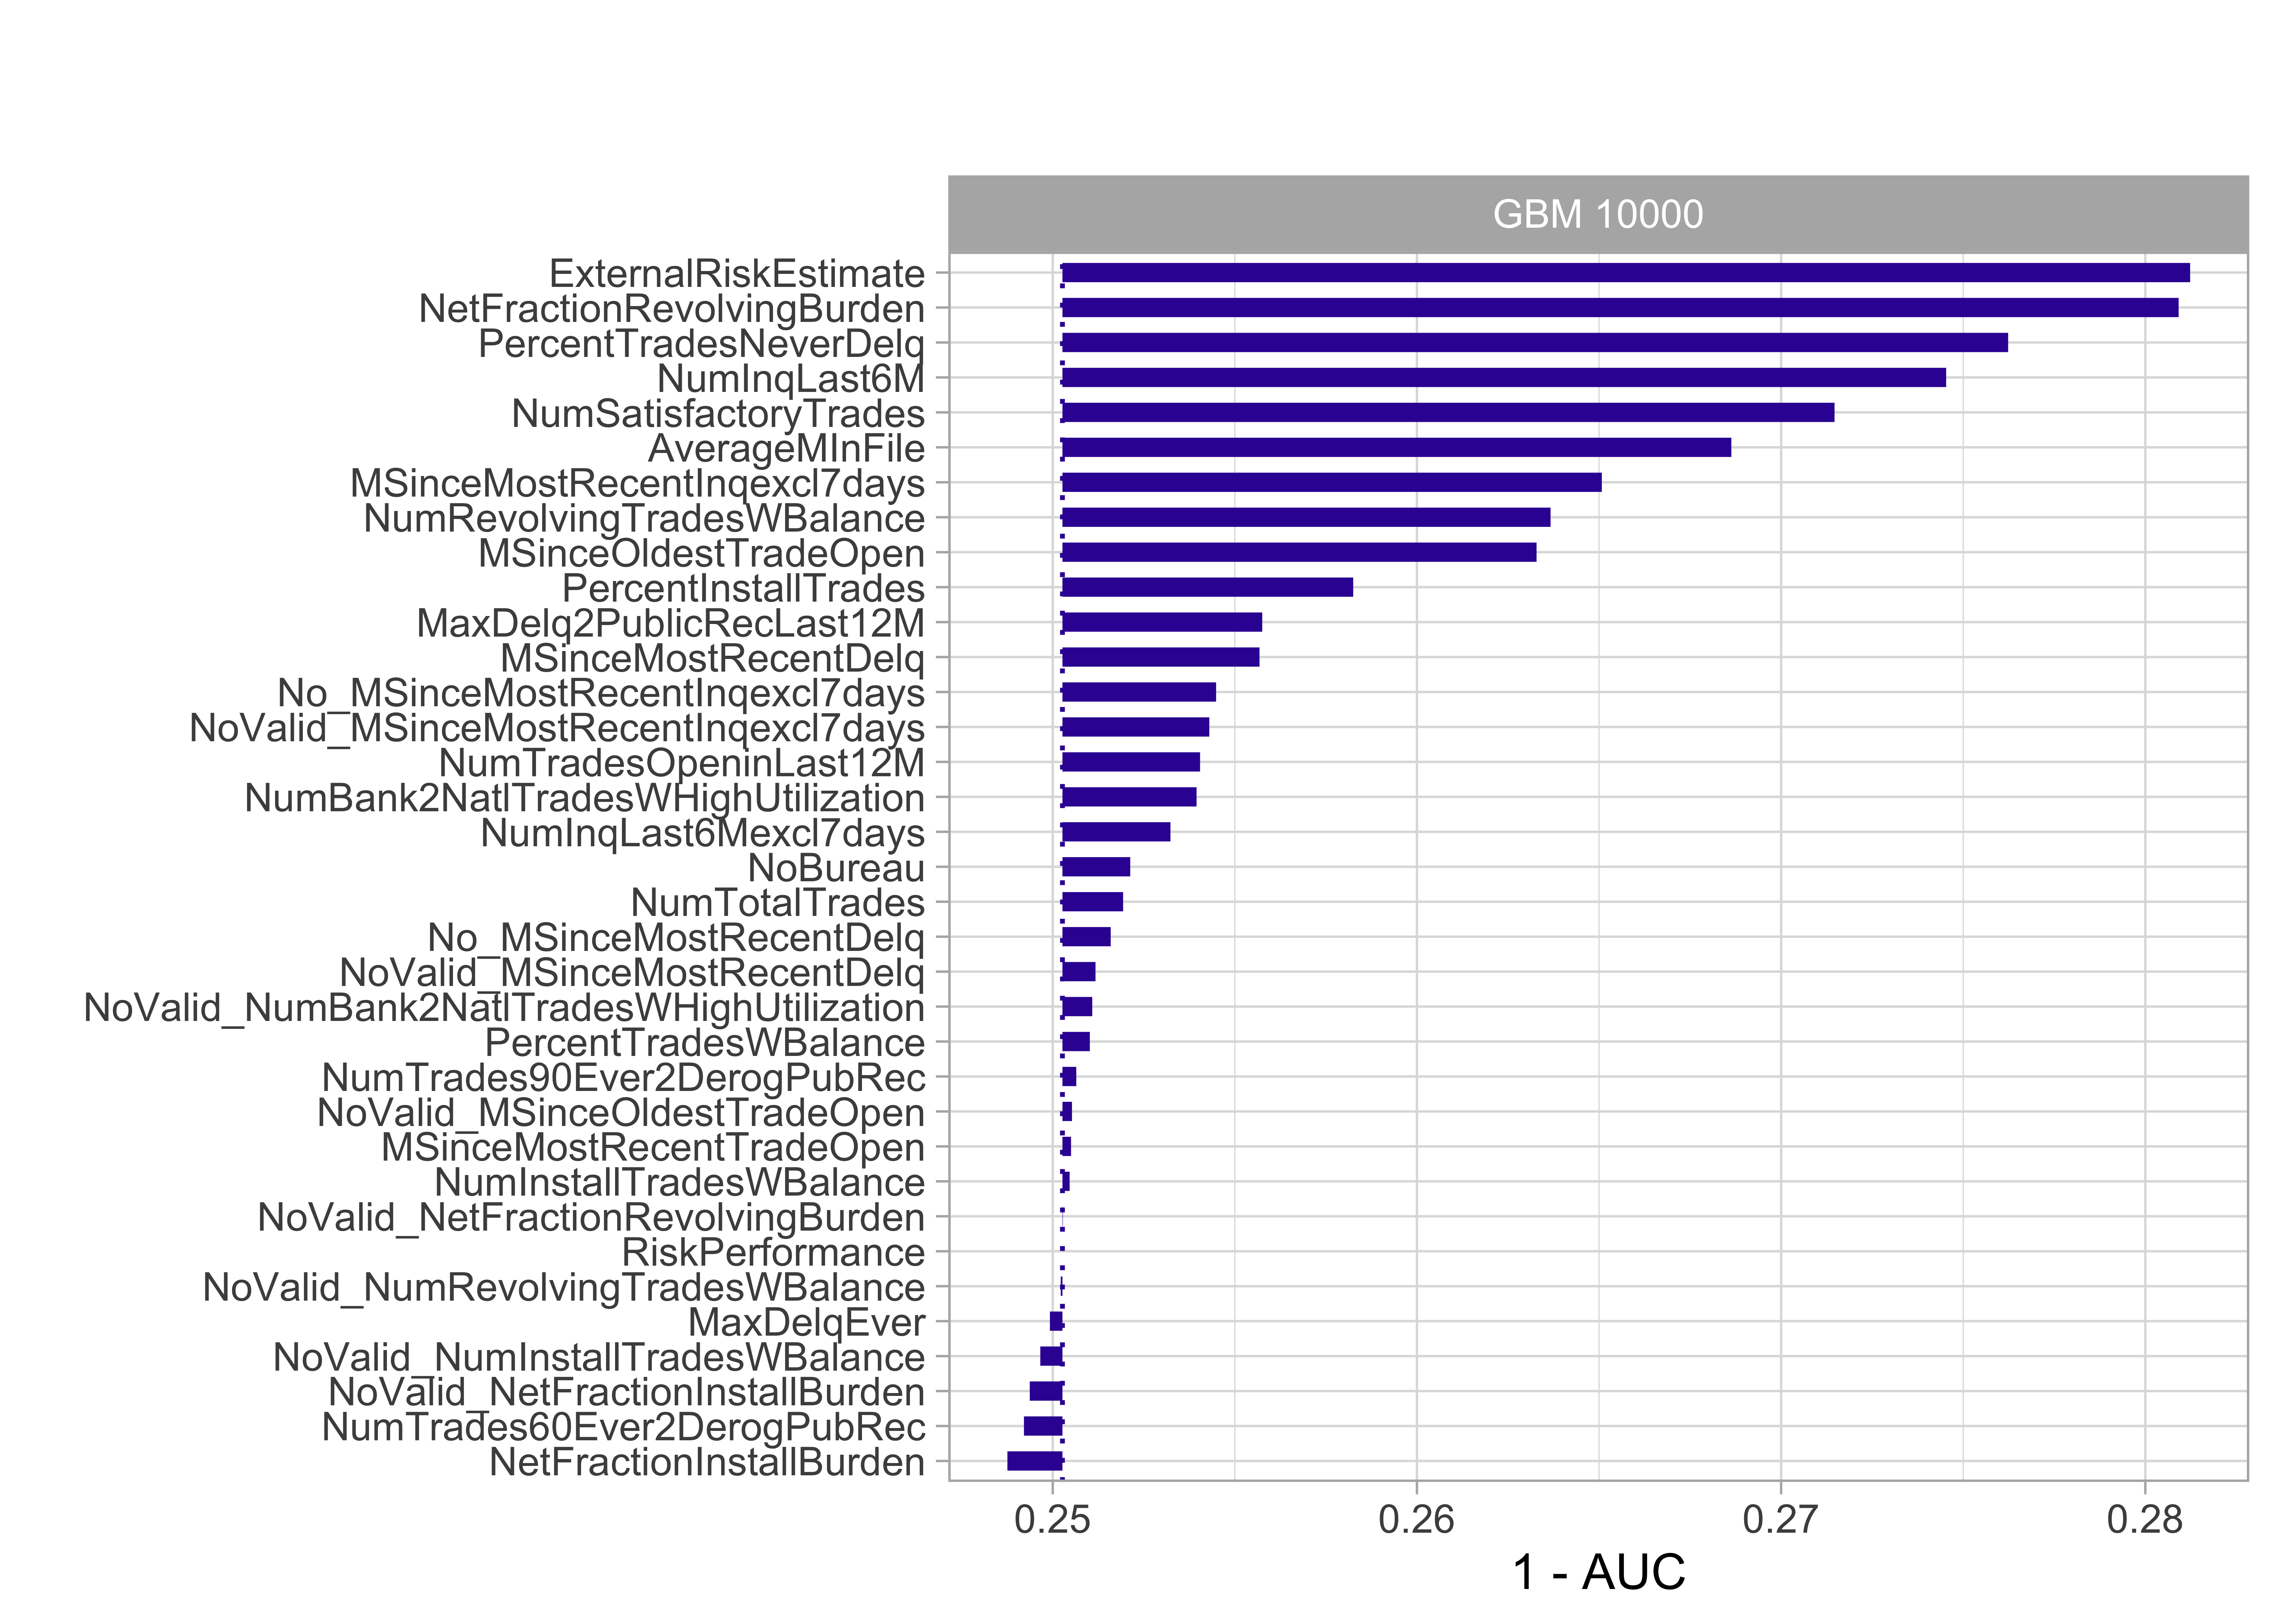
- The drop in model performance (here AUC) is measured after permutation of a single variable
- The more siginficant the drop in performance, the more important the variable
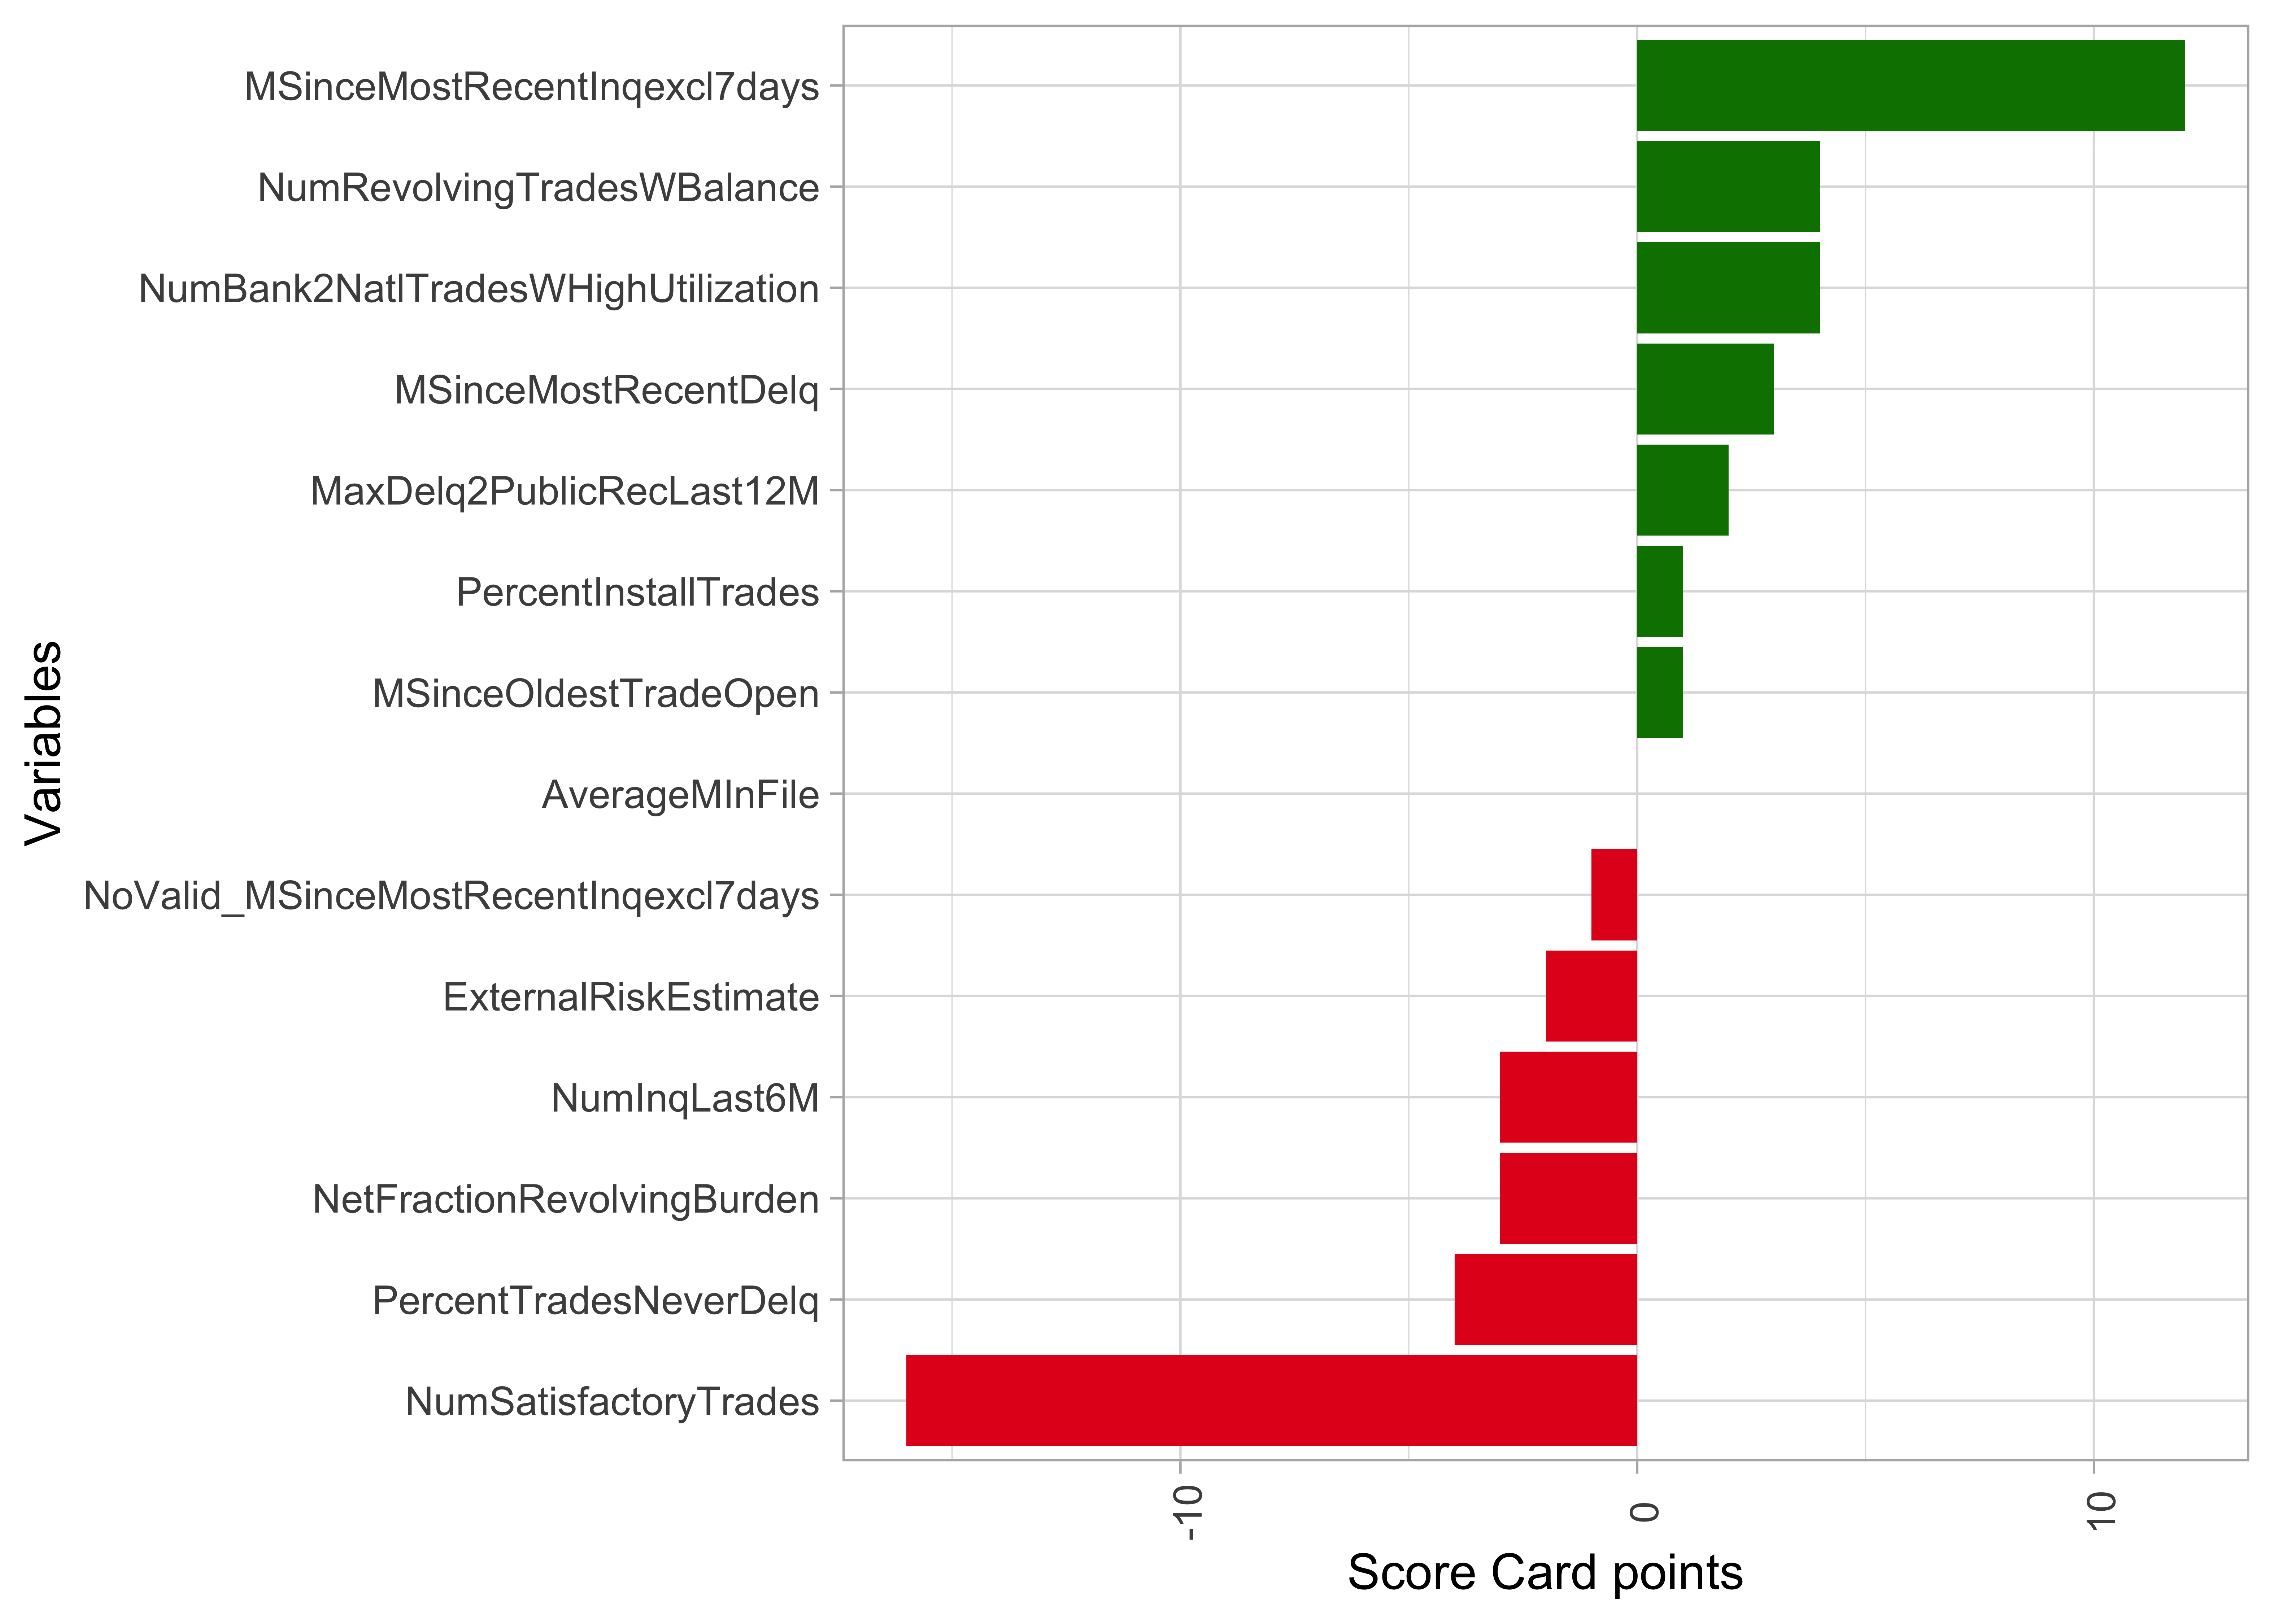
Score Card: Variable explanation based on points
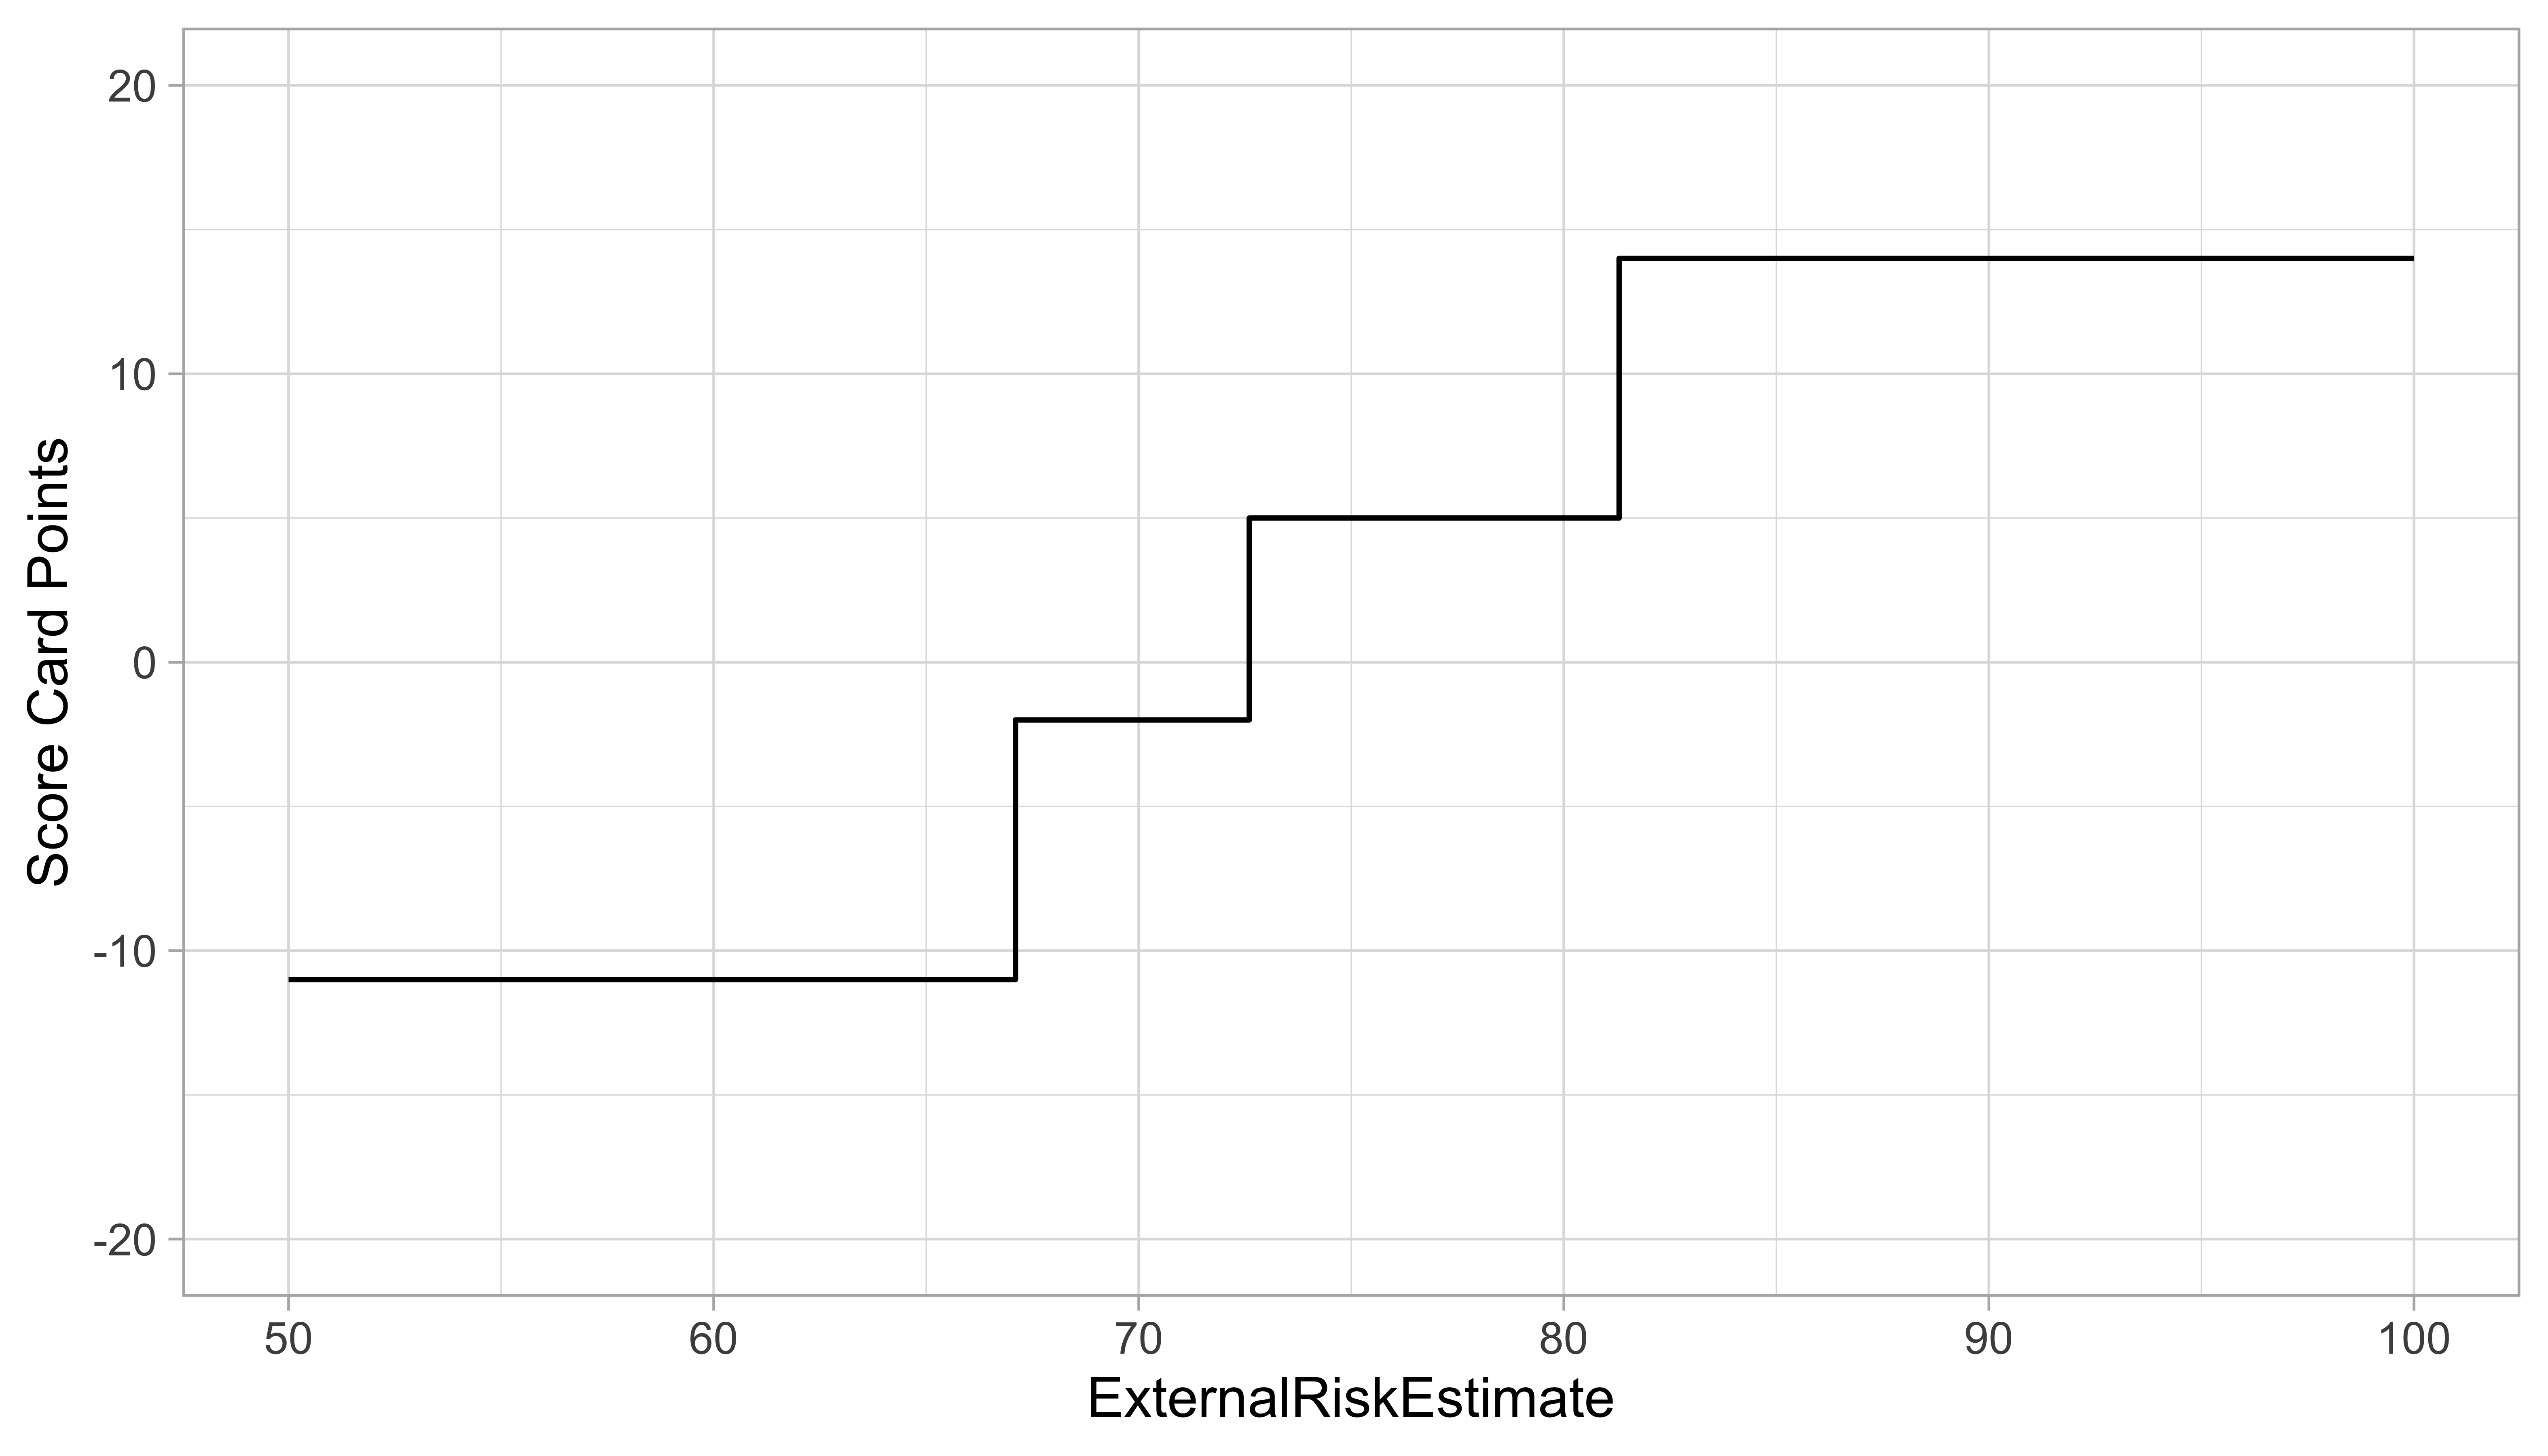
- Score Card points for values of covariate show effect of single feature
- Directly computed from coefficient estimates of the Logistic Regression
Model agnostic: Ceteris paribus profiles
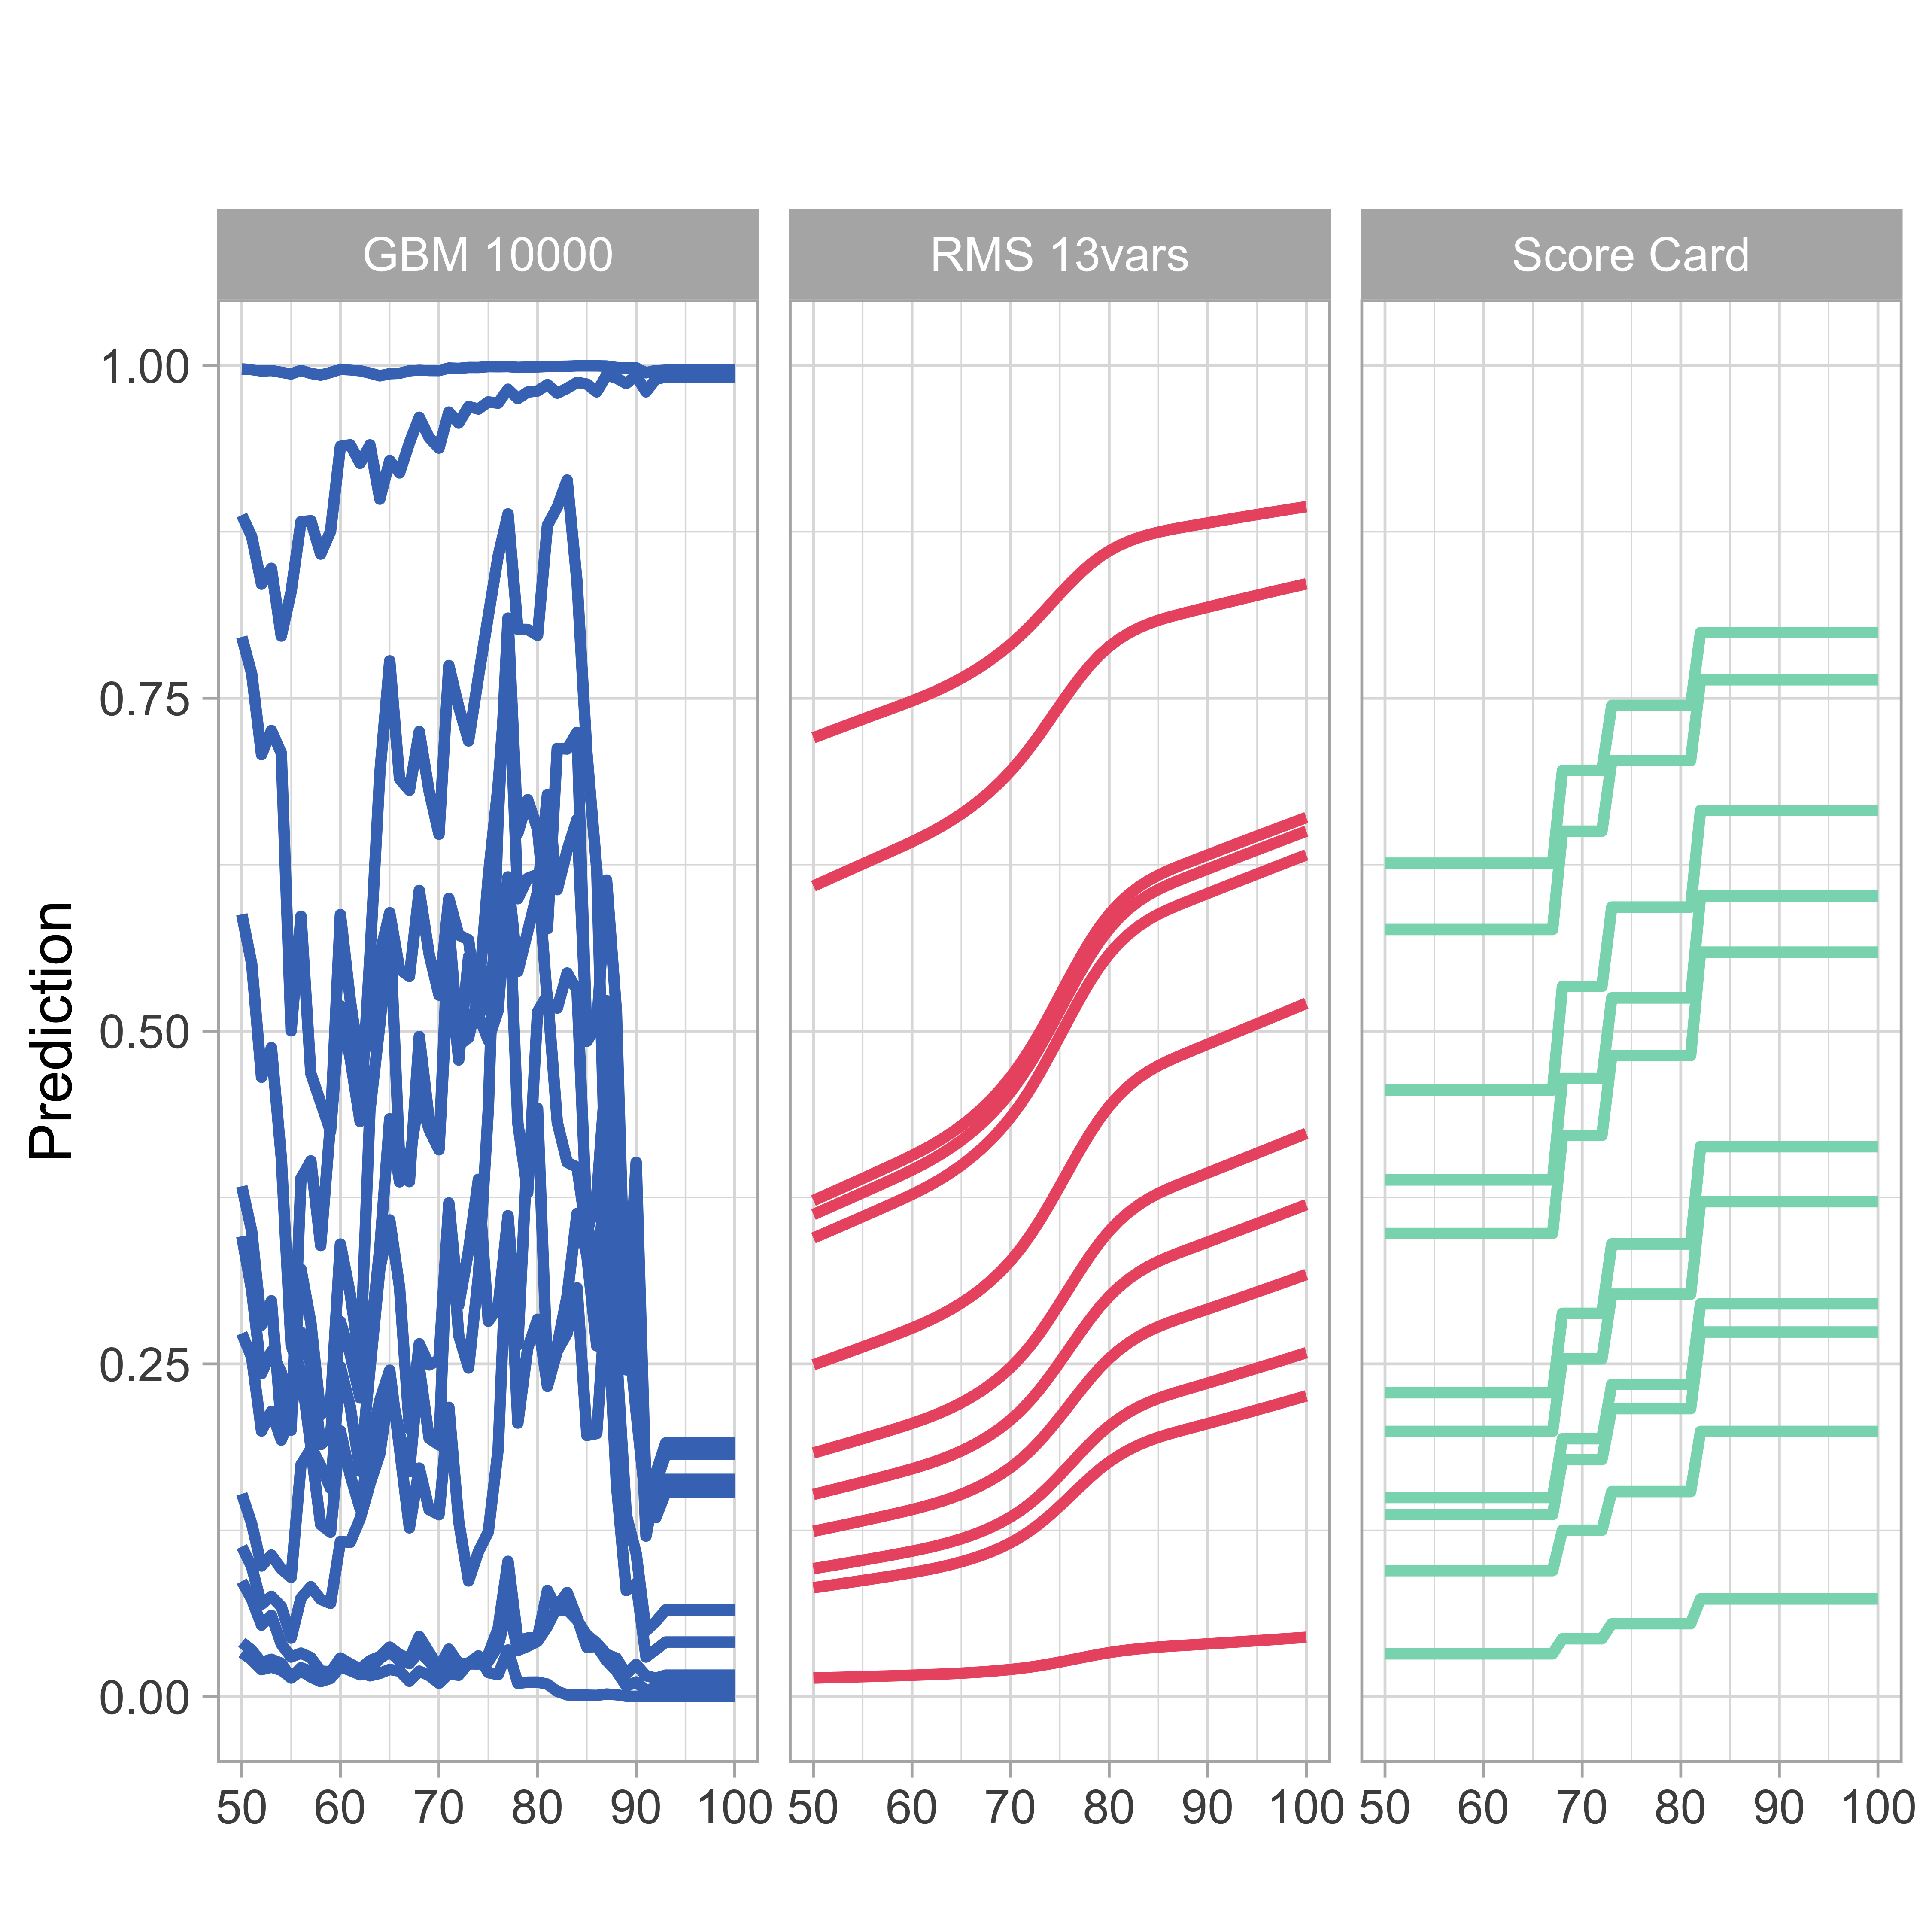
- Ceteris paribus = “other things held constant” or “all else unchanged.”
- We calculate the model predictions of 12 randomly selected customers going through the entire range of values of one covariate (ExternalRiskEstimate) while keeping the values of all other explanatory variables fixed
Model agnostic: Partial dependence profiles
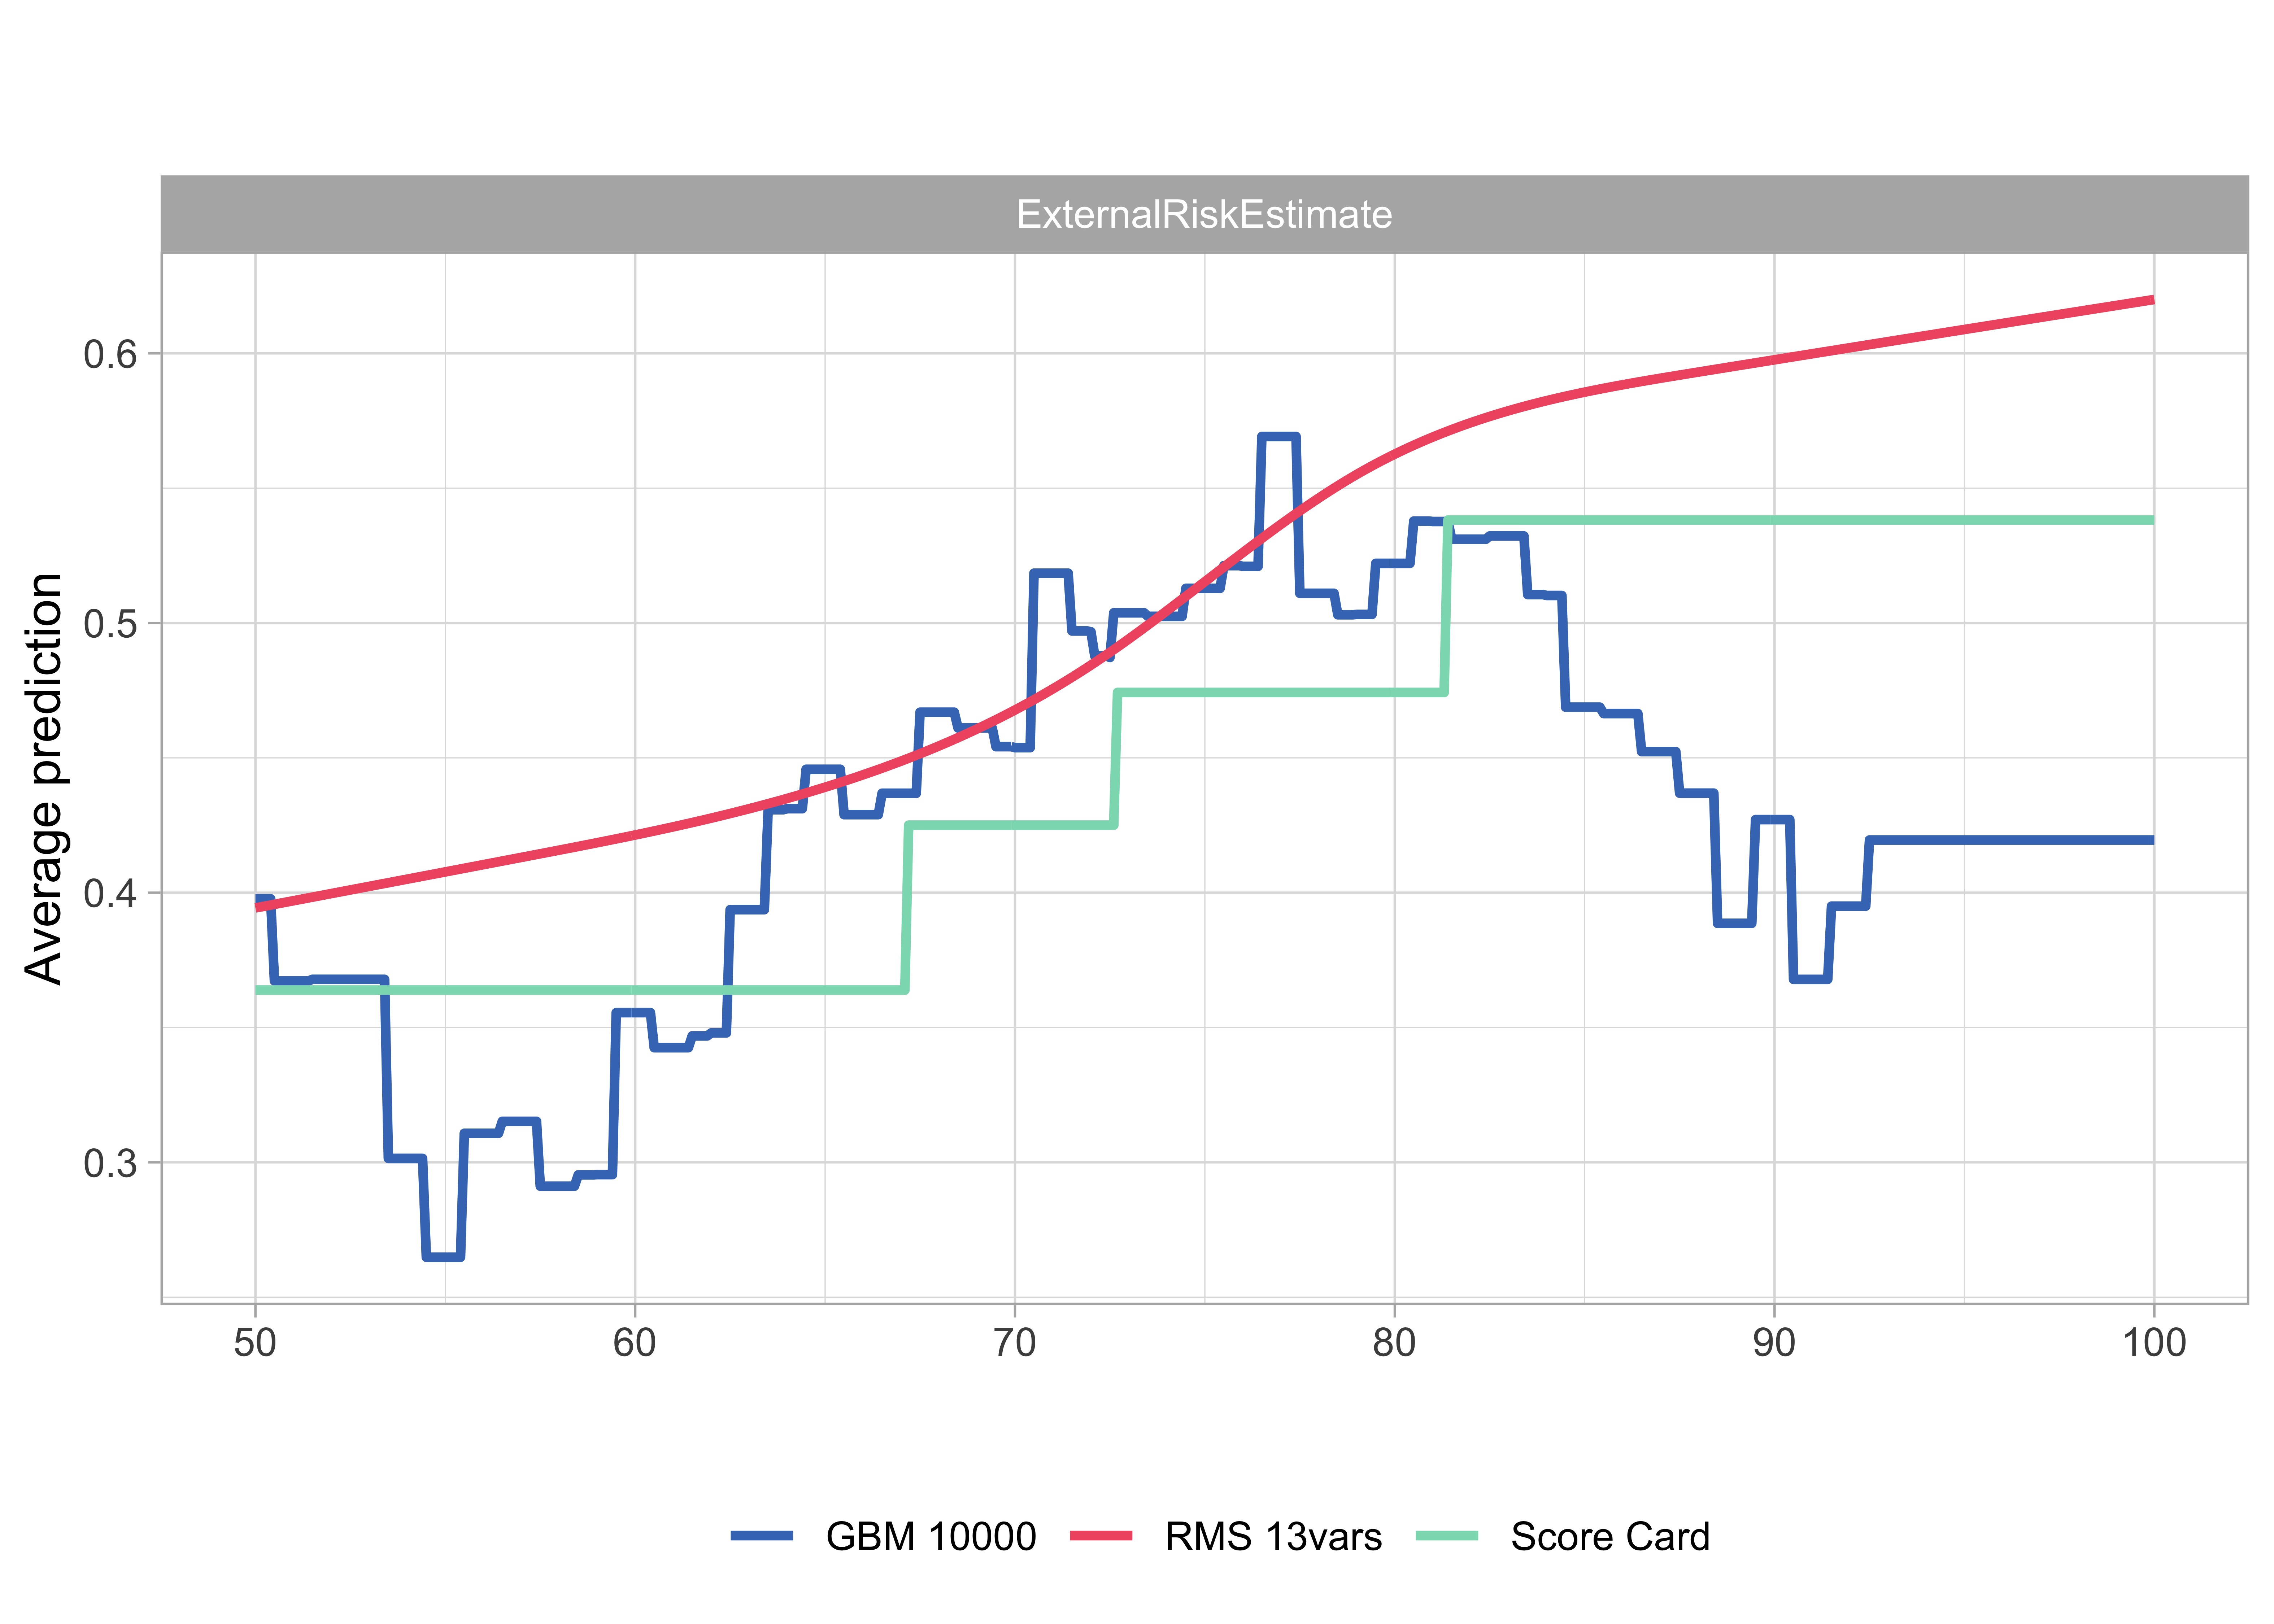
- PDPs are simple pointwise averages of ceteris paribus profiles; if number of profiles is large, it is good enough to take a smaller sample of profiles
- Interpretation very similar to marginal Score Card points
Score Card: Local explanations
- Instance-level exploration for Score Cards can simply use individual Score Card points
- This yields a breakdown of the scoring result by variable
Model agnostic: Variable contribution break down
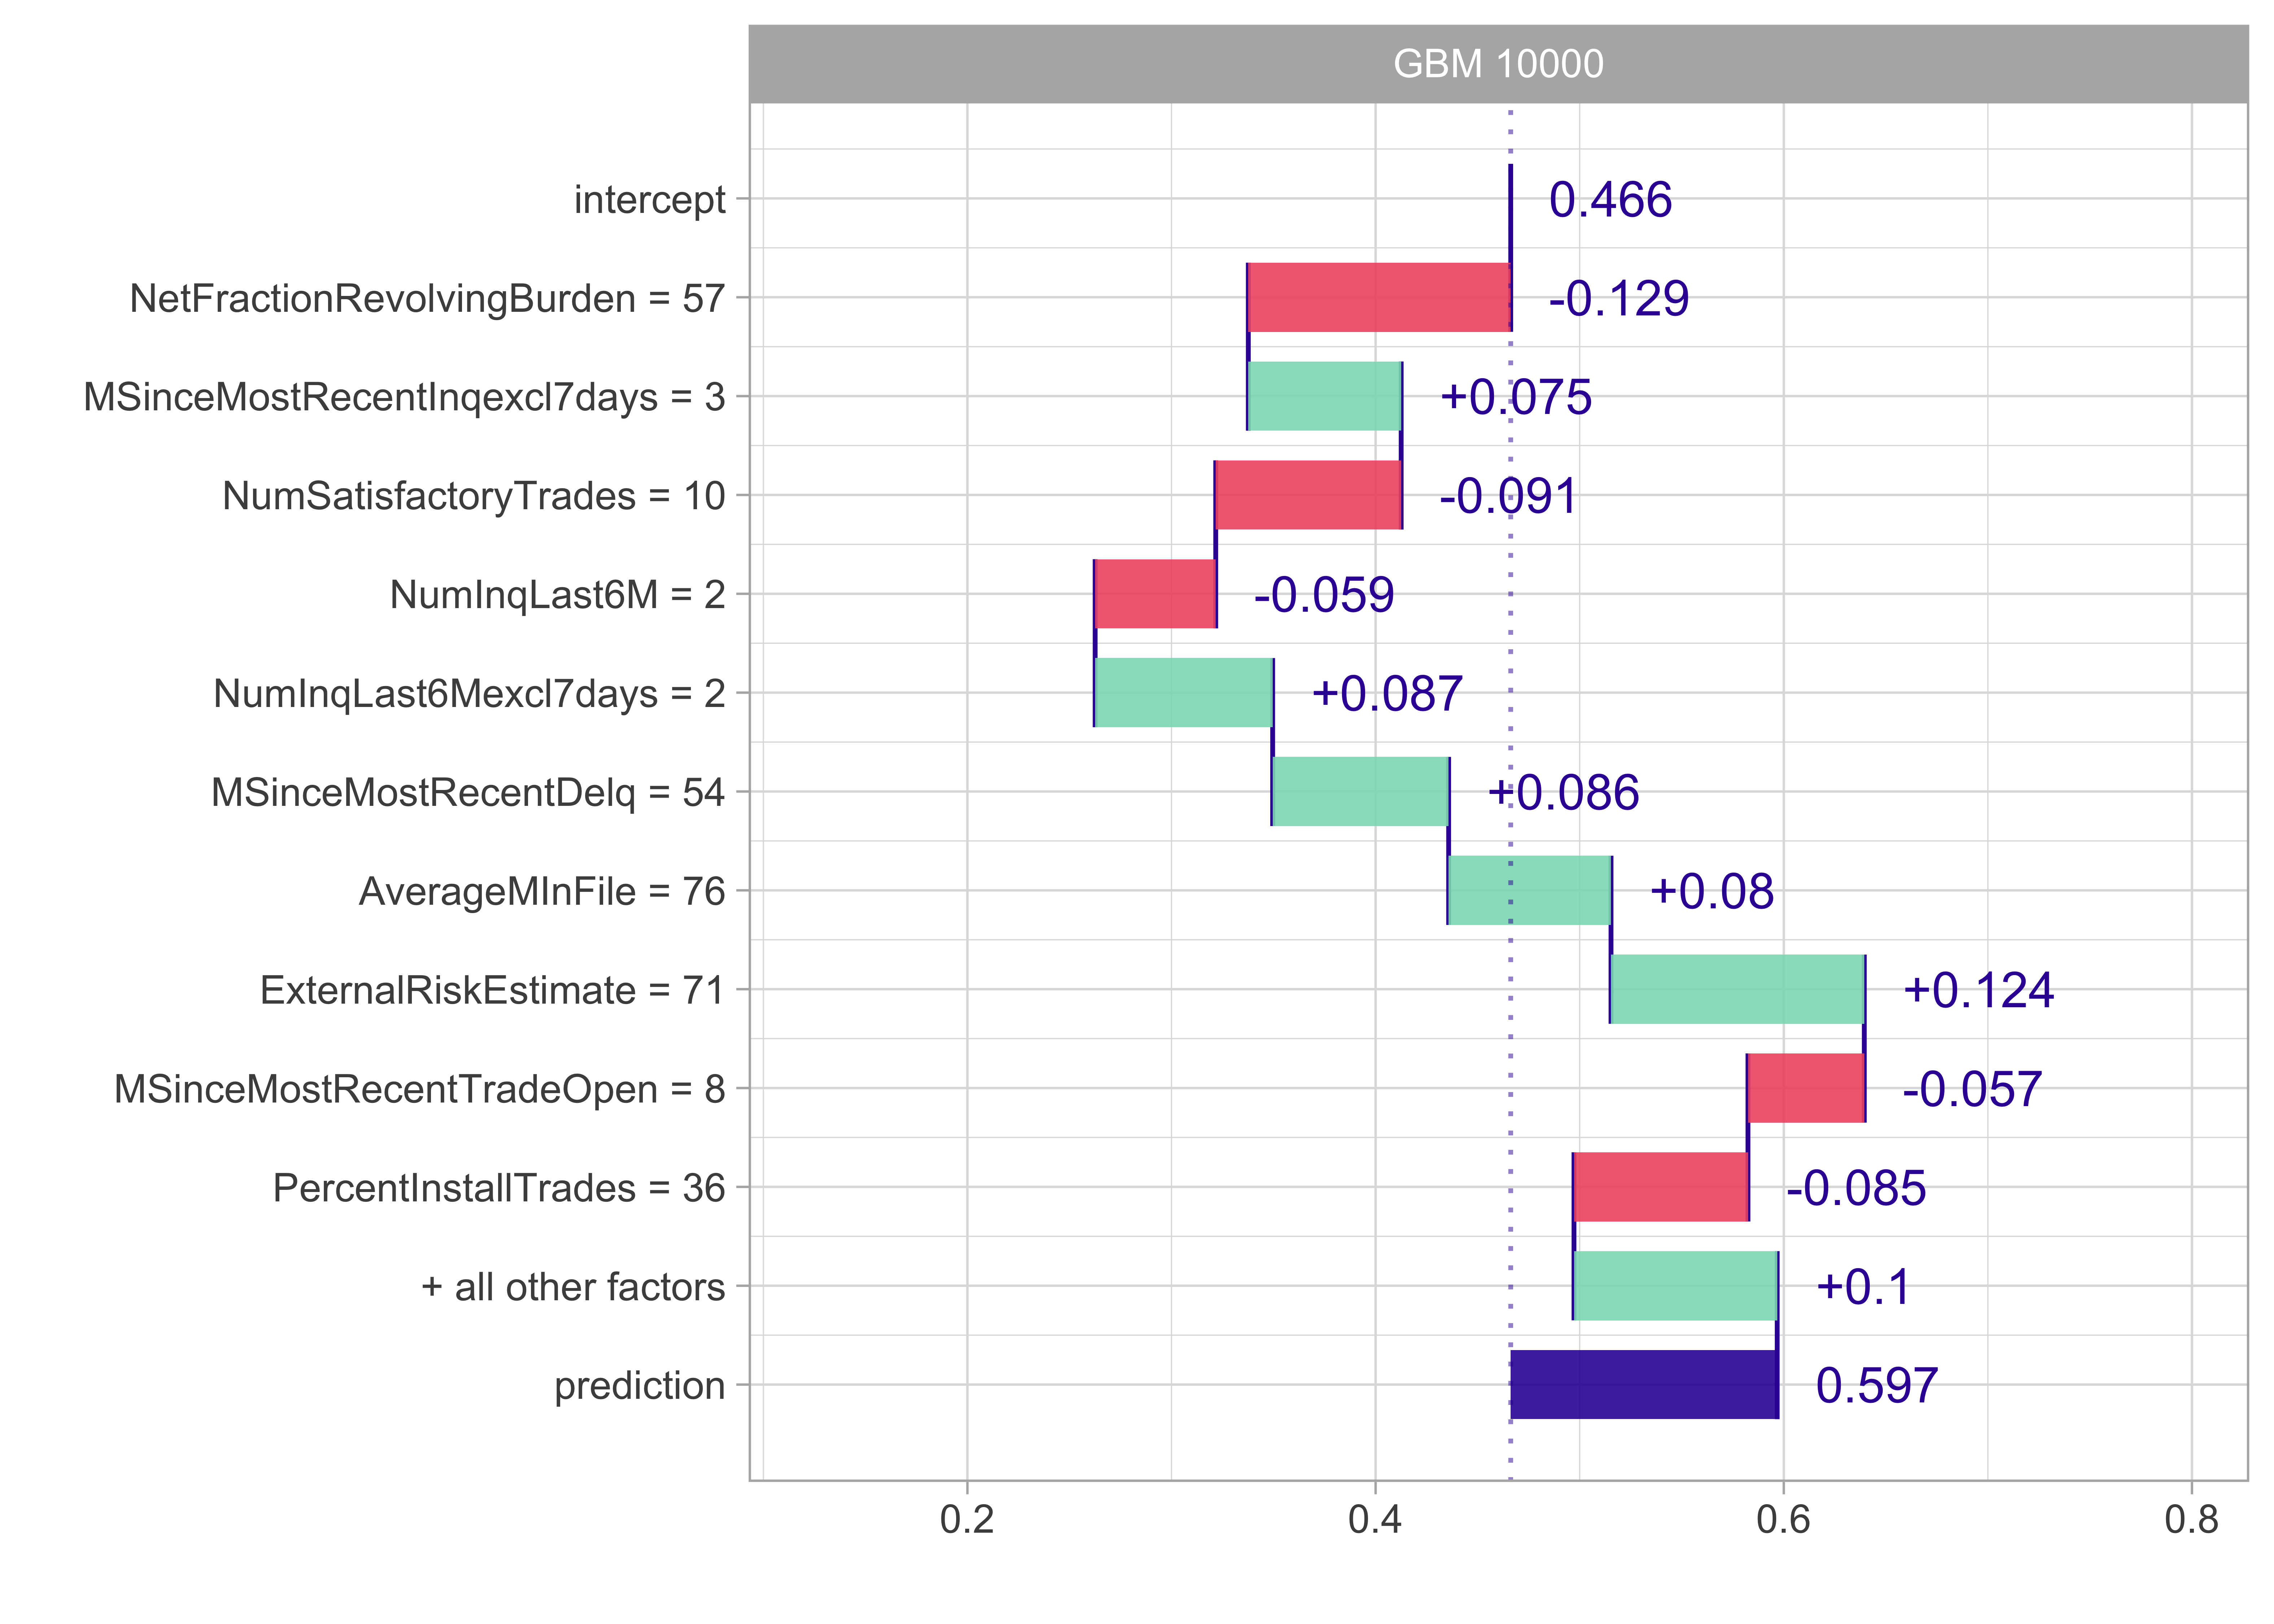
- Such instance-level explorations can also be performed in a model-agnostic way
- Unfortunately, for non-additive models, variable contributions depend on the ordering of variables
Model agnostic: SHAP
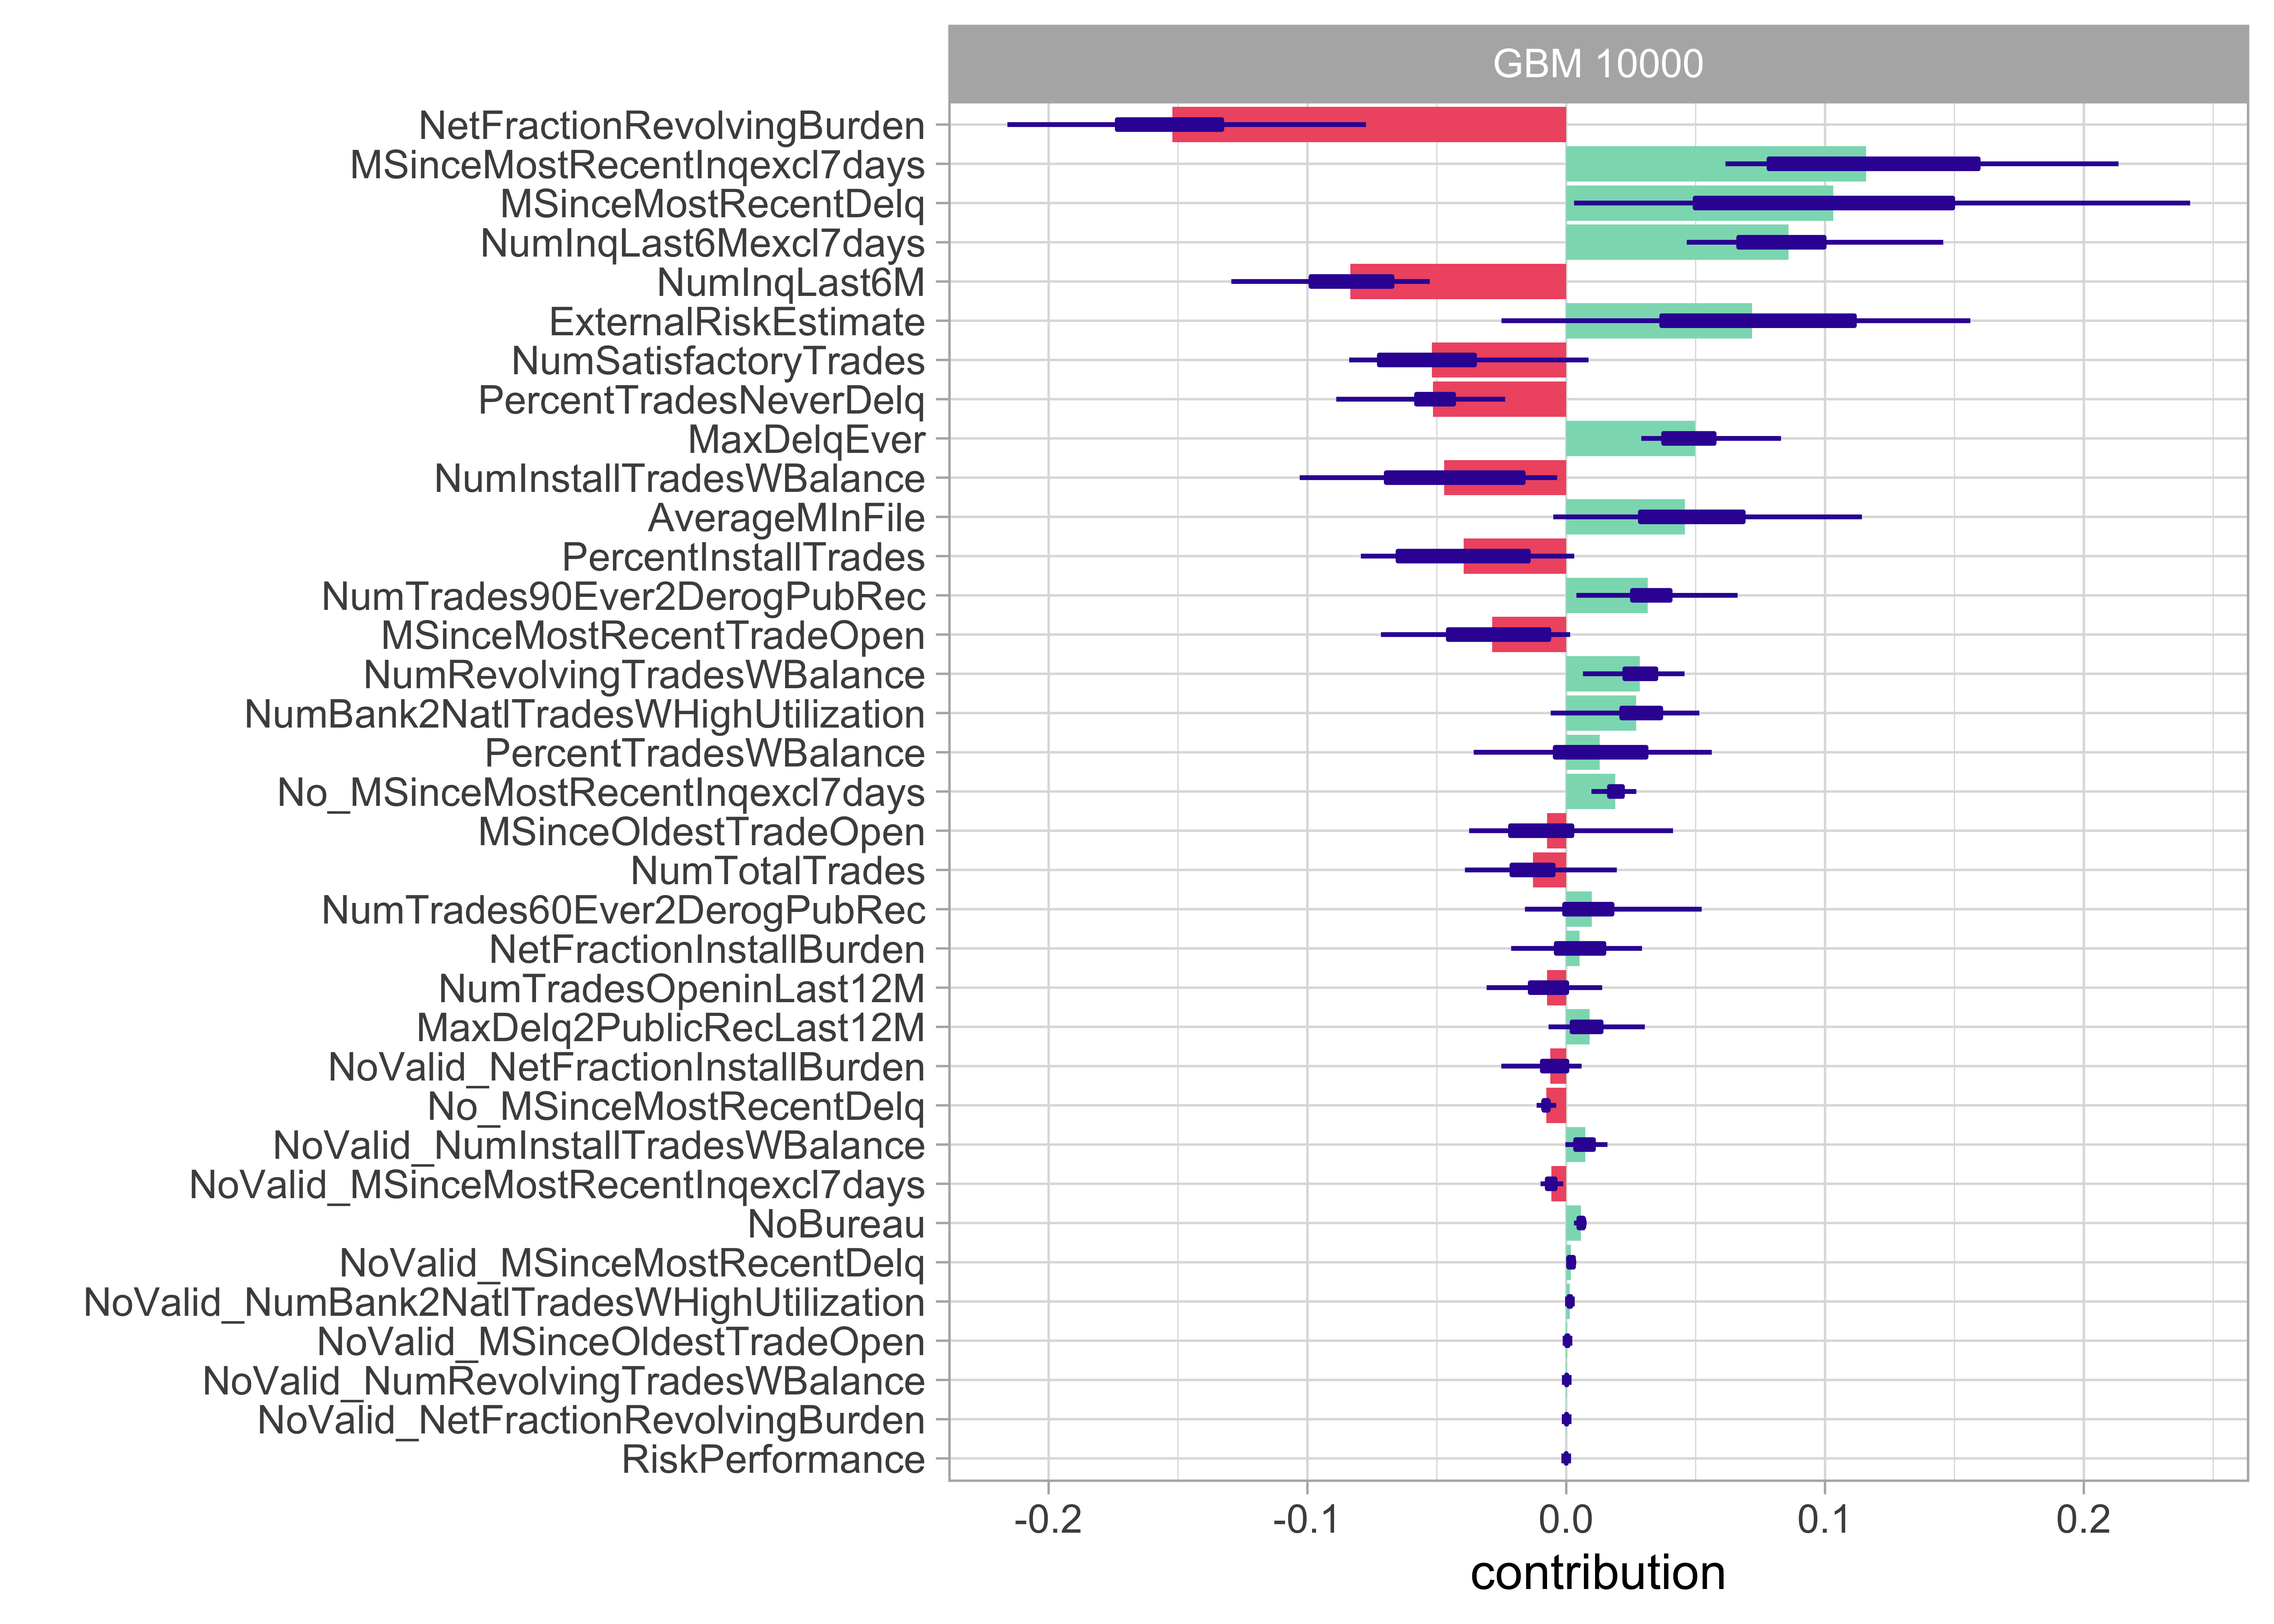
- Shapley attributions are averages across all (or at least large number) of different orderings
- Violet boxplots show distributions for attributions for a selected variable, while length of the bar stands for an average attribution

Thank you!
Prof. Dr. Michael Bücker
Professor of Data Science
Münster School of Business
FH Münster - University of Applied Sciences -
Corrensstraße 25, Room C521
D-48149 Münster
Tel: +49 251 83 65615
E-Mail: michael.buecker@fh-muenster.de
https://buecker.ms

Thank you!
Prof. Dr. Michael Bücker
Professor of Data Science
Münster School of Business
FH Münster - University of Applied Sciences -
Corrensstraße 25, Room C521
D-48149 Münster
Tel: +49 251 83 65615
E-Mail: michael.buecker@fh-muenster.de
https://buecker.ms